Measuring your audience is an essential step in developing your business on the web.
It enables you to take stock of your acquisition strategies and the quality of your traffic. Google Analytics is a powerful tool for accessing quality information.
Google Analytics: an indispensable tool for your company’s success
To ensure the success of your e-commerce or lead generation site, you need to make data analysis a priority.
You need to understand consumers’ needs, where they are, their gender and age, and anything else that might help you improve their experience on your site.
The more information you have about them, the more you’ll be able to personalize your approach, identify problems and improve your communication.
The number of people affected
You can find out how many people are affected each day.
This measurement enables you to understand whether your advertising actions are having an impact, and whether you’re continuing to increase your audience and traffic.
Which acquisition channels
Internet users can arrive on your site through various channels: social networks, search engines, partner sites, etc.
The acquisition report identifies how your prospects arrived on your site. This may be through your advertisements, or your Facebook page…
Once you know where visitors are coming from, it’s vital to identify the channels that bring you the most conversions, so you can intelligently allocate your investments to the right channels.
Using Google Analytics to measure your audience enables you to perfect your communication tools.
In fact, through analytics data, you can find out where your audience leaves your site, and identify the pages where they leave.
To keep prospects on your pages longer, we recommend A/B testing. This practice gives you the opportunity to imagine two strategies and evaluate their impact.
You can choose between two approaches, and only keep the one that really works.
Measure your audience to know it perfectly
This free tool gives you access to various indications:
Most visited pages The social network where you have the most impact Usage habits: smartphones, computer, tablet
Conversion rate
The main objective of your e-commerce business is to generate sales and find customers.
Google Analytics gives you a helping hand by telling you which channels have helped you sell and convert. So you need to ask yourself the right questions:
Are your social networks powerful? Do your advertising campaigns convert? Have you seen a return on investment?
Google Analytics, made available to you free of charge by Google, should become your best ally in developing your e-commerce business.
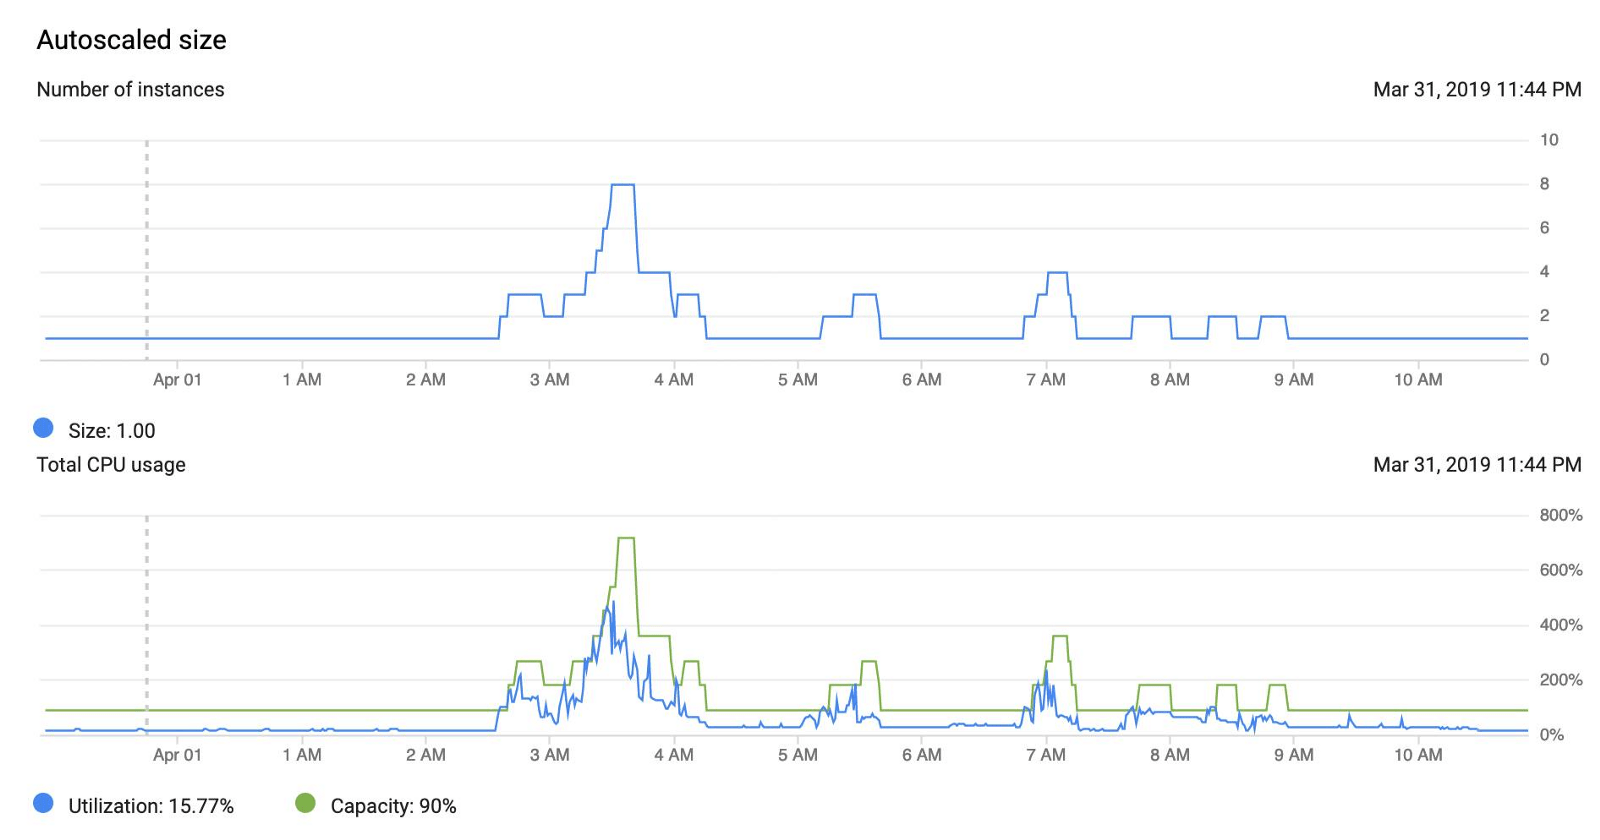
The cloud is everywhere, and we hear about it on every street corner. Chances are you or your company use a cloud service in one way or another (AWS, Google Cloud, to name but two).
If you use it intensively (several machines running continuously), you may be interested in auto-scaling.
Auto-scaling allows you to add or remove machines as needed, in near-real time. For example, when user traffic increases dramatically and your servers are underwater, auto-scaling lets you add machines to free up the load on existing servers, reduce response times for your users and maintain the quality of service you offer.
Without auto-scaling, the opposite problem also exists: in off-peak periods, your machines have nothing to do, but you pay them anyway.
This is of course good for the Cloud platform you’re using, but not so good for you.
At Adenlab we use Google Cloud, and of course we use auto-scaling. The need is as follows: at night, we import data from your Google Ads, Analytics, Amazon, Bing, etc. accounts.
We learn from this data (machine learning), calculate new bids for your products, and update them on the relevant platforms. And we do so much more! All this every night.
Each of these operations has specific requirements in terms of volume and machine power. For example, we have some powerful machines for machine learning, and many less powerful machines for updating auctions.
Having so many full-time machines would be a net loss of budget, since most of them have nothing to do during the day. We therefore group these machines according to their type (power, etc.) into groups, called Auto-Scaling Groups.
Auto-Scaling Groups
Auto-scaling groups (ASGs) are used to group machines of the same type under the same auto-scaling policy.
By default in Google Compute Engine (GCE), you can choose to scale according to CPU or memory usage. Using the Stackdriver monitoring tool, you can create custom metrics to increase or decrease the number of machines.
Unfortunately, it’s impossible to automatically scale an ASG to zero, i.e. to cut all the machines in the group. This is quite logical, since in the absence of a machine we would no longer receive any metrics (CPU or other) leading to re-scale again.
In our case, many of our machines work at specific times of the day, usually for 8 to 10 hours at a time, and will have nothing to do for the rest of the day. Here’s an example of how our auto-scaling policy works:
We have a machine that does nothing for almost 2/3 of the day.
Auto-scaler to machine zero
Of course, we’d like to avoid having to pay for a useless machine. We’ll see that there’s a way to have zero machines and still have an automatic scaling system.
However, there is one prerequisite: we need a way of knowing when it’s time to scale up again.
At Adenlab we use a taskqueue(MRQ) for our recurring jobs. MRQ allows us to route our jobs to specific worker groups, depending on the queue and/or the task itself. Each worker group is linked to an ASG, so we have a clear metric here: for a given ASG, do we have any jobs queued?
With all this, we can use the following ASG structure:
A small (read: inexpensive) machine that will always be up (not self-leveling)
One or more ASGs, without auto-scaling policy
By creating an ASG without an auto-scaling policy, GCE will let us scale to zero machines if we want. On our little machine, we’ll have a script that runs every 5 minutes and checks each MRQ worker group for jobs to process.
If this is the case, the script will create an auto-scaling policy for the worker group concerned, and scale it up to 1 machine. The auto-scaler can then add additional machines as required, depending on the base metric configured (in our case, CPU utilization).
Let’s write an MRQ task for this script. Already the necessary imports :
from mrq.task import Task
from google.oauth2 import service_account
from googleapiclient import discovery
import time
import re
First, we need to configure a few parameters concerning GCP :
class ScaleUp(Task):
    project_name = "name of your GCP project"
    zone = "europe-west1-c" # adapt your zone here
    service_account_path = "service_account_credentials.json"
    # groups that are not concerned by this task
    groups_to_skip = ("group1",)
Add to groups_to_skip the worker groups that should not be auto-scalated: at least add the group of the machine that will unstack this task.
Now let’s write the main method of our task:
def run(self, params):
    credentials = service_account.Credentials
        .from_service_account_file(
            self.service_account_path
        )

    self.service = discovery.build(
        "compute",
        "v1",
        credentials=credentials,
        cache_discovery=False
    )
    # We need to have a way to know what we want our different
    # autoscaling policies to be.
    # We could store them in a DB and fetch them here,
    # so that it is shared with our Ansible playbooks for instance.
    # For simplicity here we'll just hardcode them here:
    self.autoscaler_configs = {
        "group2": {
            "min_replicas": 1,
            "max_replicas": 10,
            "cooldown": 180,
            "cpu_target": 0.80
        },
        "group3": {
            "min_replicas": 1,
            "max_replicas": 8,
            "cooldown": 180,
            "cpu_target": 0.90
        }
    }
    # First we need to fetch existing ASGs
    self.fetch_groups()
    # Next we want to know which groups currently have an autoscaler
    self.fetch_autoscalers()
    # Check each groups and see if we should scale them up
    self.check_groups()
Here’s how to retrieve ASG information:
def fetch_groups(self):
    self.groups = {}
    request = self.service.instanceGroupManagers()
                          .list(
                            project=self.project,
                            zone=self.zone
                          )
    while request is not None:
       response = request.execute()
       for asg in response['items']:
           group_name = asg["baseInstanceName"]
           self.groups[group_name] = {
                "base_name": group_name,
                "name": asg["name"],
                "size": asg["targetSize"],
                "link": asg["selfLink"]
            }
       request = self.service.instanceGroupManagers()
                             .list_next(
                               previous_request=request,
                               previous_response=response
                             )
We hydrate self.groups with ASG information. For more info on ASG structure, see here.
Now let’s take a look at the code we’ll use to create an autoscaler for a given worker group:
You can find the wait_for_operation code in this example.
The last thing we need is a method for scaling up an ASG:
def scale_up(self, group, size=1):
    if self.groups[group]["size"] > 0:
        # Already scaled up
        return
    # Make sure we have an autoscaler
    if not self.autoscalers.get(group):
       self.create_autoscaler(group)
    operation = self.service.instanceGroupManagers().resize(
        project=self.project,
        zone=self.zone,
        instanceGroupManager=self.groups[group]["name"],
        size=size
    )
    wait_for_operation(operation)
The final logic of our task is quite simple:
def check_groups(self):
    # Now we have everything we need for the actual task logic:
    for group in self.groups:
    if group in self.groups_to_skip:
        continue
    if self.should_scale_up(group):
        self.scale_up(group)
should_scale_down is the method that should contain your scaling logic. We don’t provide it here, but remember that in our case it’s a question of checking whether or not we have jobs waiting to be processed.
This task is scheduled to run every 5 minutes. This is convenient for our use case, because even if there are no pending jobs, a team member can perform an action at any time, which will result in the creation of a new job.
We don’t want to have to wait too long for it to be started. Of course, for any user actions that create jobs and are supposed to get a quick response, we need a dedicated machine that’s always up.
In most cases, however, it’s best to avoid asynchronous tasks for user interactions that require feedback.
So now we can scale up a machine when we need it, and GCE will take over if we need more. But we also need a way to scale down to zero when we don’t need it again!
To do this, we have a second task, running every 30 minutes, which will execute the same code as the first, with the difference that it will remove the autoscaler and scale to 0 machines if there are no pending jobs.
We can inherit our new task from the previous one, so that we have all the methods we need to communicate with GCP :
class ScaleDown(ScaleUp):
We also need some new methods to scale down:
def delete_autoscaler(self, group):
    autoscaler = self.autoscalers[group]
    operation = self.service.autoscalers().delete(
        project=self.project,
        zone=self.zone,
        autoscaler=autoscaler["name"]
    )
    wait_for_operation(operation)

def scale_down(self, group):
    if self.groups[group]["size"] == 0:
        # Already scaled down
        return
    # Delete the autoscaler so that we can scale to zero machine
    if self.autoscalers.get(group):
      self.delete_autoscaler(group)
    operation = self.service.instanceGroupManagers().resize(
        project=self.project,
        zone=self.zone,
        instanceGroupManager=self.groups[group]["name"],
        size=0
    )
    wait_for_operation(operation)

def check_groups(self):

    for group in self.groups:
        if group in self.groups_to_skip:
            continue
        if self.should_scale_down(group):
            self.scale_down(group)
When we know there are no more pending jobs, we remove the autoscaler and scale down completely. Again, should_scale_down contains the scale down logic to be implemented.
The positive side of this approach is that we can have several scaling criteria. For example, to avoid scaling up and down several times in a row too close together, we can also check that a certain amount of time has elapsed without a job being created before scaling down.
Conclusion
We have seen that by deleting the autoscaling policy, we can delete all the machines in an instance group.
We’ve written an autoscaling task that uses custom logic to determine whether a group should be up (1 machine) or down (0 machine).
The disadvantage is that we have to have a separate machine, always up and ready to unpack our autoscaling task.
Creating a dynamic campaign on Facebook and Instagram: problems and solutions
If you’re an e-merchant and you want to ensure your visibility on Facebook, it’s probably because 35 million French people are registered there.
You’ll have several options for launching advertising campaigns on Facebook and Instagram. One of the most effective and ROI-saving is the Dynamic campaign. Dynamic ads are automatically served with images from your product feed.
Dynamic ads use the Facebook Pixel to show ads to people who have already visited your e-Commerce site and products.
Here we describe the recurring problems and solutions we’ve brought to e-merchants when setting up and launching Dynamic campaigns.
We’ll take a look at two examples of errors that prevent e-merchants from running dynamic campaigns on Facebook and implementing an effective Remarketing strategy for their audience.
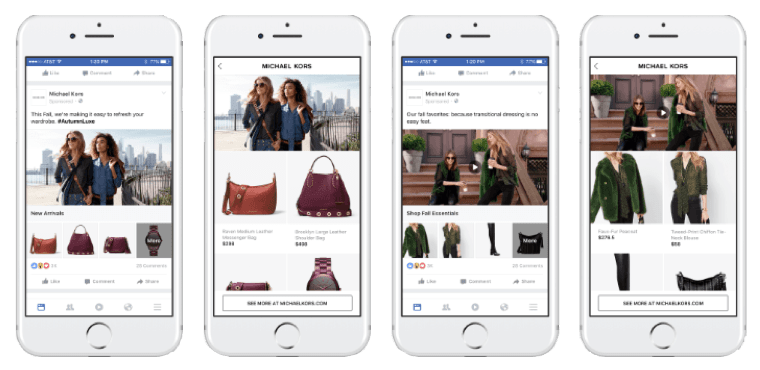
It’s a process, or rather a marketing strategy, for delivering targeted ads to an audience that has visited your site or mobile application. In the case of our dynamic campaigns, the advertisements are images of products that have been visited on your site by the same users, who then browse on Facebook or Instagram: this is the remarketing or retargeting strategy.
Example of a mobile Facebook catalog ad
We won’t dwell on audience creation and targeting here. However, we do recommend reading “The Guide to Facebook Ads for Ecommerce”, in which you’ll find several examples of audience creation. Indeed, to ensure a high Return on Investment, you’ll need to master the segmentation of your audiences and campaigns in your account.
What are the recurring problems?
When we set up a dynamic campaign for an E-Commerce, we have to make sure that all the products in the catalog are integrated into the Business Manager… This is also where we run into “problems”!
What are the recurring problems that prevent the creation and launch of dynamic campaigns?
We’ve listed below some of the errors we regularly encounter; We imagine you’ve also encountered this type of error message:
No products in the Facebook “catalog
Rejected products in Business Manager
The Pixel with the wrong settings
Inability to launch remarketing campaigns
With this type of discouraging message, you’re still a long way from reaching your target audience. But with the tips below, you’ll be able to target the right audiences and develop your return on investment on Facebook.
How to resolve errors
Below are two technical cases with detailed resolutions. In the first case: all your products are rejected and in the second case: it is impossible to run dynamic campaigns because the products are not recognized by the Facebook Pixel.
Let’s get down to the nitty-gritty of creating dynamic and remarketing campaigns! And off you go to target advertising to a qualified audience!
We assume that you have access to :
A Facebook Business manager
Catalog in CSV or XML format
A Facebook Pixel installed on your site
Case 1: 100% OF PRODUCTS ARE REJECTED!
How do you go from 100,000 rejected products to 100% of the catalog being accepted? You’ll need to use the Facebook feed import rules
Case 2: MISSING PRODUCTS IN YOUR PRODUCT FLOW & PIXEL MATCHING ERRORS
Avoid missing identifiers in the catalog. Ensure that 100% of pixel events can be used for remarketing (view content).
Case 1: All products in the catalog are rejected
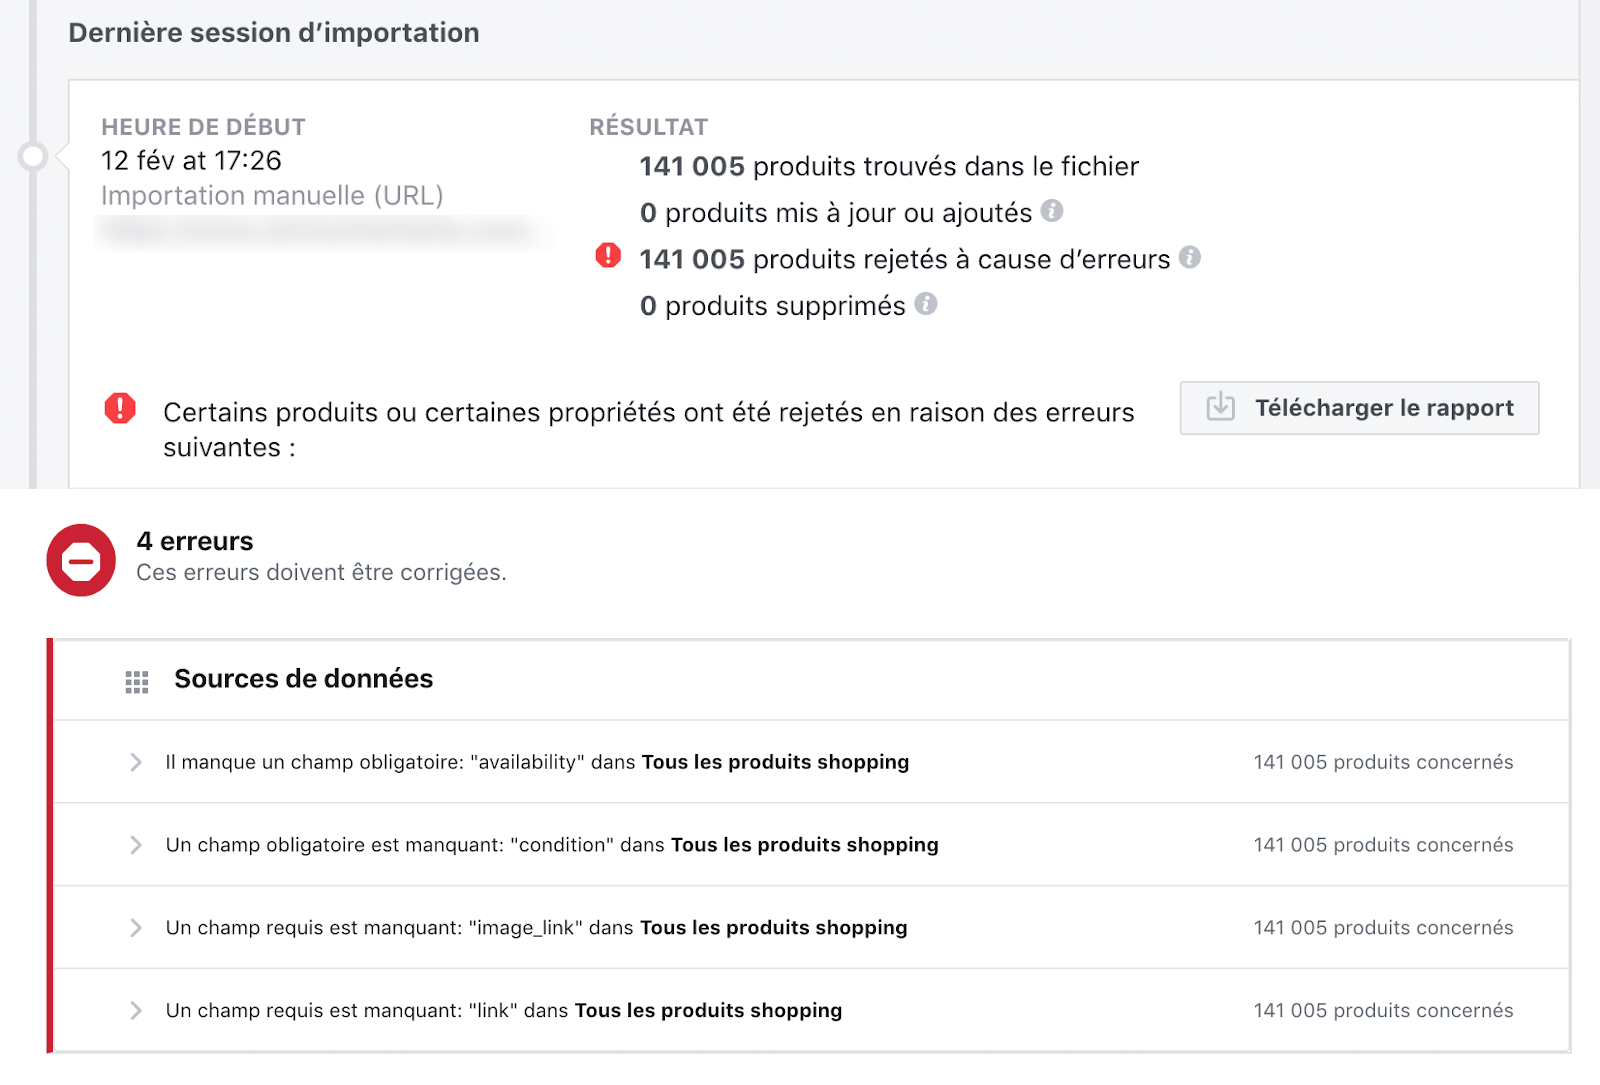
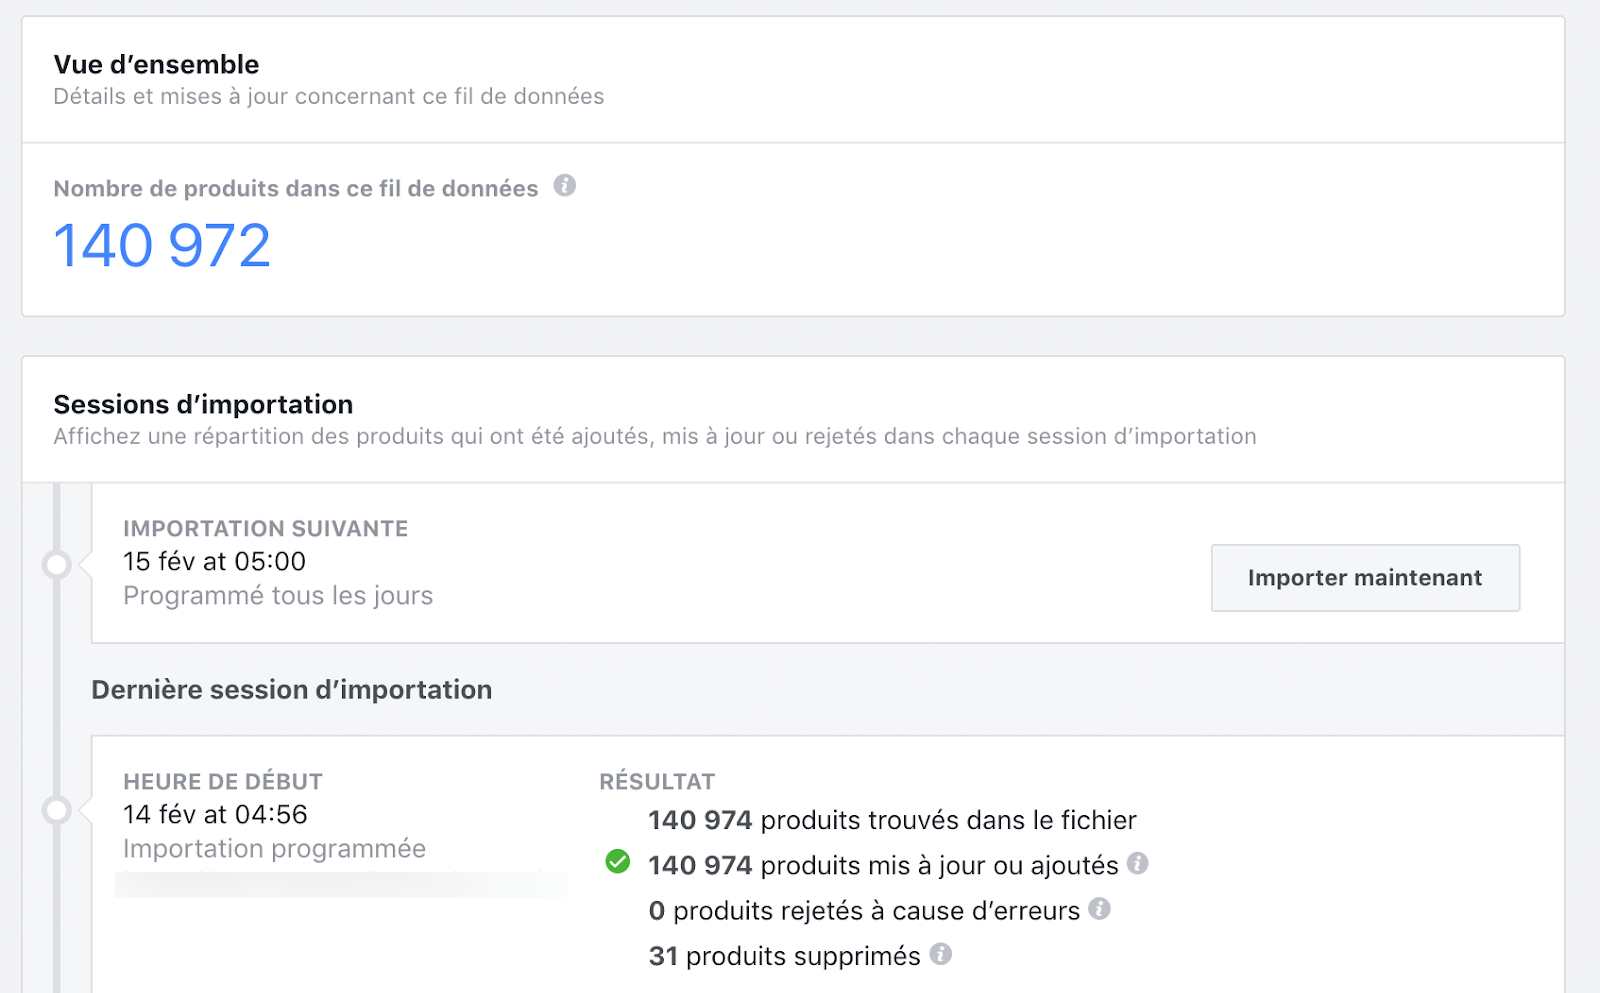
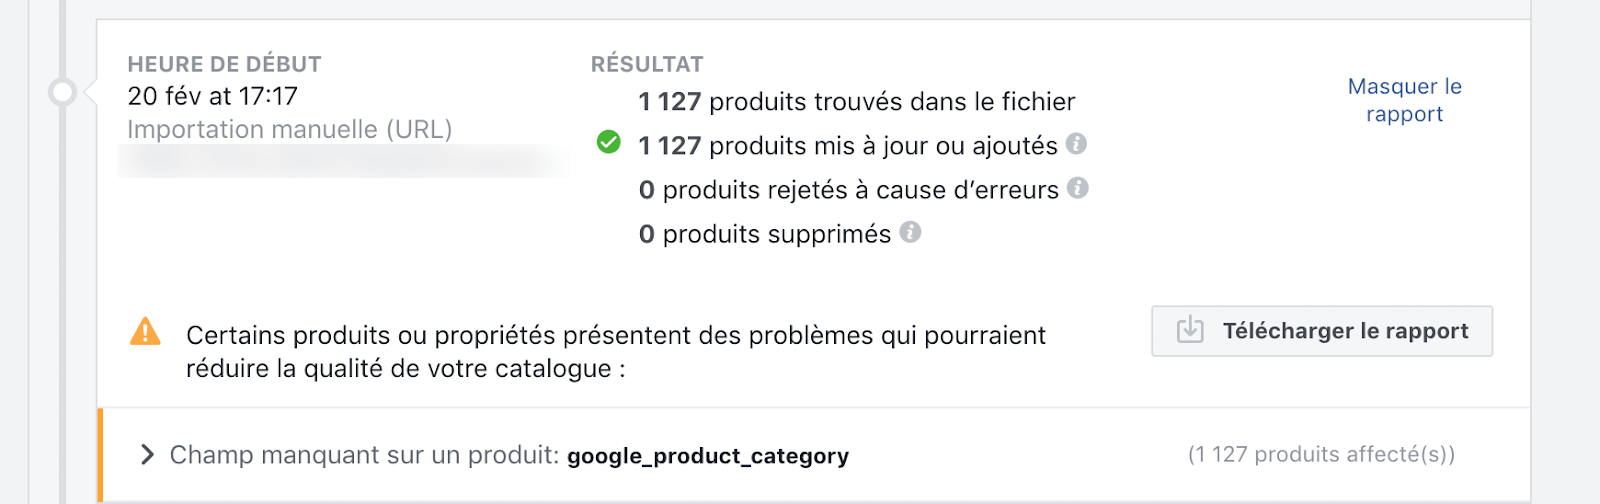
In this first case, when the product feed was integrated into the Facebook Catalog, all the products were rejected. In the screenshot below, you can see that 141,005 products have been added, but none of them have been updated.
=> 100% of products are rejected !!!
Creating a feed can lead to an error-filled diagnosis. Fortunately, Facebook messages are a great help.
Example of an error report
In the screenshot above, you can see that 141,005 products have been rejected and that 4 errors need to be corrected.
Here a mandatory field is missing for 4 attributes: “availability”, “condition”, “image link”, “link”.
1. FINDINGS
When we delved into the feed and its attributes, we realized that the “link” field didn’t exist, but that the “link” field did. Here’s a little subtlety we weren’t expecting! The Business Centre doesn’t translate automatically
The same goes for “availability”, which is present as “disponibilité”.
Facebook has not matched these attributes, which are the same but simply not translated.
We therefore have a feed set up in French in Facebook whose attributes are not recognized by the Business Manager.
2. SOLUTION
We’re in luck: Facebook’s feed optimization tool is easy to use and allows us to rework the feed without having to generate a new one.
In your Business Manager, in the “Catalog” section, “Product data sources”, select your feed, then the “Settings” tab.
Product data source
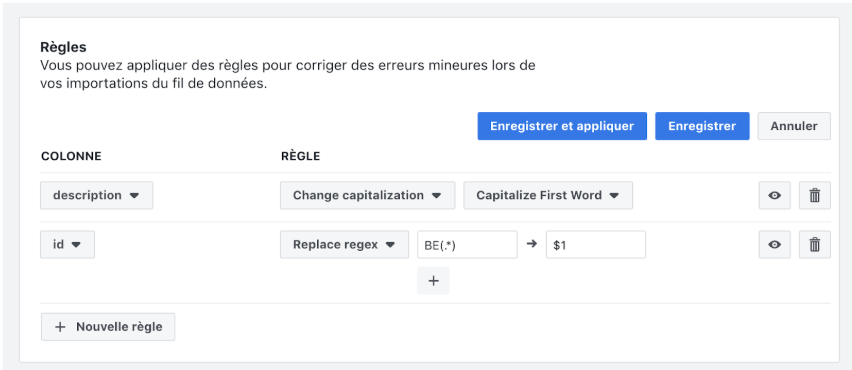
In “Rules” we can add transformations such as :
availability ->
The values change from “in stock” to “in stock”, and so on for each column.
In the cases below we have implemented a dozen matching rules to validate our flow:
Example of Facebook catalog import rules
You can see the progress by saving or restarting the feed import by clicking on “retrieve”.
Of course, it may not work the first time.
You’ll probably have more luck than we did; our catalog, in addition to being in French, is not in UTF-8 but in ISO-8859, creating other problems.
3. RESULTS
When we re-import the catalog, all 140,972 products are accepted.
Catalog imported without error
All the products are gone!
There are still some caveats, but we can still use our catalog for our remarketing campaigns with dynamic ad formats.
Case 2: Pixel events are not eligible for catalog remarketing
When we talk about “pixel events”, and in our case “views”, we’re actually talking about visitors to your pages, and more specifically your product pages.
In our case, all you have to do is look at the explicit Facebook messages to understand that there’s a problem somewhere.
1. FINDINGS
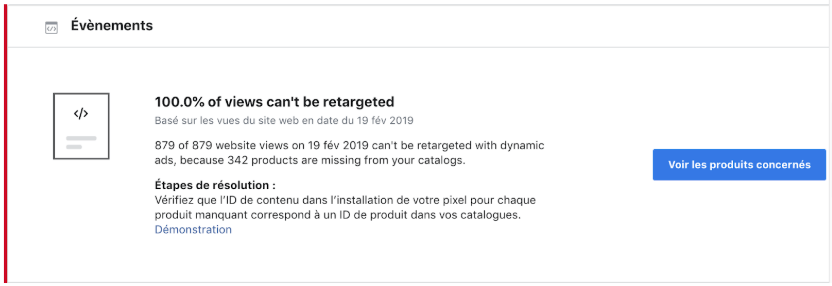
Below, Facebook tells us that we can’t retarget visitors to our site with dynamic campaigns because the products aren’t identified or rather “missing” from the catalog.
Event error indication
You can take a closer look at the list of events concerned.
The product pages are not actually linked to the “Catalog” we imported into the Business Manager.
Let’s open the product flow and see what’s going on.
Example of Pixel information versus product catalog
The IDs in the initial feed have a 2-letter prefix referring to the target country: here BE20563(highlighted in yellow) in the feed.
However, Facebook shows an ID without the prefix “BE” with only the numbers “20563”.
Facebook can’t find this pivot automatically
2. SOLUTION
Let’s give him a hand by using his flow transformation rules tool.
Facebook provides comprehensive feed optimization tools and recommendations.
Flow transformation rules tool
Here, we’ve added a new modification rule using aregex.
BE(.*) means we want to capture all characters after BE, this result will be automatically defined in $1.
In this example, we use everything after BE (which is our Pixel identifier).
This syntax may seem barbaric, but it’s a computer standard: more info.
3. RESULT
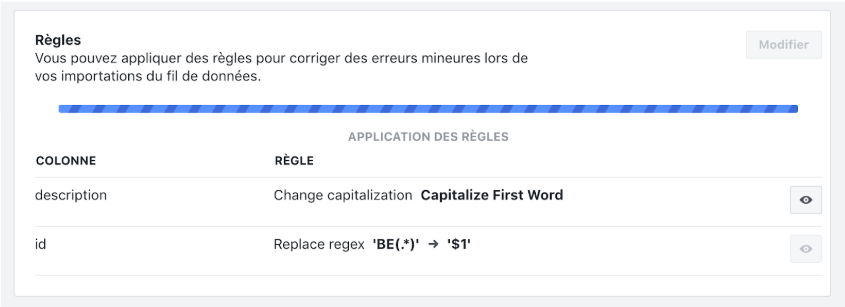
Apply and watch the Facebook preview
Example of regex application preview in Facebook
Perfect! Our identifiers now look good.
All that remains is to wait for the new Pixel events to be assigned to the right product in the catalog.
Successful catalog import
Now that our 1127 products have been identified, we can start a new campaign!
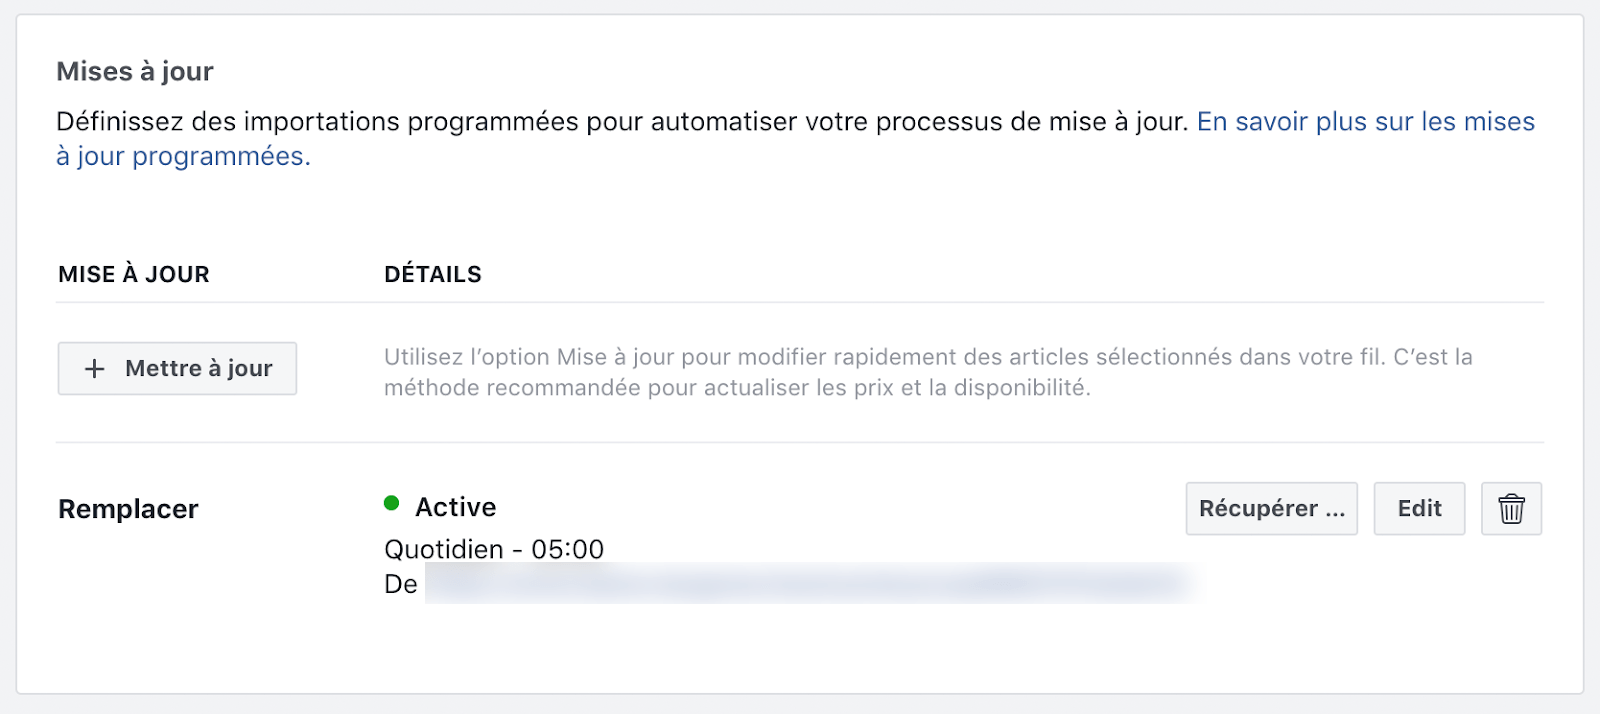
#Hint# : the import was scheduled for 2 a.m., when the feed seemed to be generated. By delaying the import by a few hours, we waited for it to be fully generated before retrieving it to get all the products.
Example of catalog import time change
How can you set up all these elements if you don’t have all this technical knowledge?
Finding solutions to a problem can take time and research.
In the example above, some solutions are simply not to be found on Facebook sites or other forums.
Our knowledge of product flows and our in-house software development for catalog optimization enable us to find solutions quickly.
Your summer and winter sales are great opportunities to increase your sales volumes and reach your annual sales targets.
Anticipate and prepare your Google Ads campaigns to make them effective and profitable during these busy times of the year. You can always call on a specialized agency, a Google Ads Certified agency, to support you.
The sales last 6 weeks, but as you know, the first week is decisive.
Search trends: “SOLDE” in France
Sales” queries start to rise 2 weeks before the start of the sales. The volume of products bookmarked on e-commerce sites starts to rise considerably 5 weeks before the start of the sales.
1. Increase your online visibility:
Start increasing the visibility of your Shopping and Adwords campaigns 2-3 weeks before the sales. Take advantage of a less aggressive competitive strategy and low cpc.
Our predictive solutions make it easy and efficient to analyze our customers’ competition, increase product visibility across their entire catalog, and develop campaign performance and ROI thanks to our algorithms and automations.
2. Adapt your budget and increase the share of voice for your key campaigns:
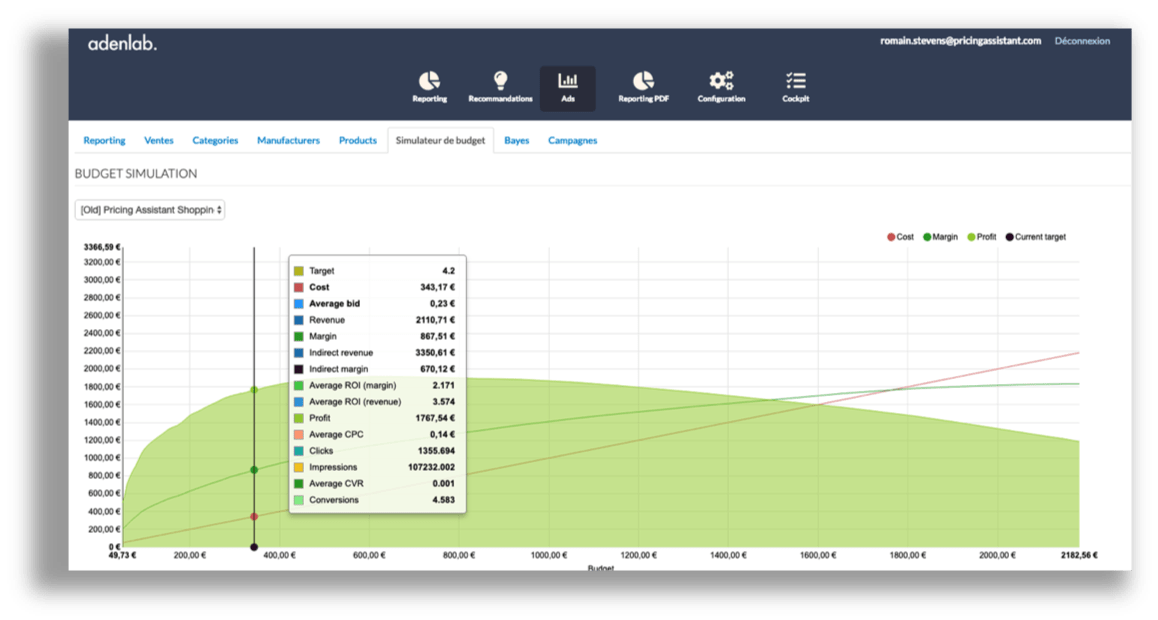
Thanks to our Machine Learning algorithm, we run simulations to identify the budget that will maximize the overall ROI of your Google Shopping campaigns.
Budget and Product Performance Simulator
3. Optimize your campaign keywords and ads:
Develop your lists of keywords related to previous sales.
Cover your entire catalog
Maximize the impact of your ads. Rework and personalize your Text ads
Check your ad extensions and customize them.
Adenlab ‘s solutions and our agency’s proprietary software create campaigns, keywords, ads and extensions easily and automatically.
They allow you to personalize your ads according to the elements (metadata) in your catalog.
Adverts can be updated automatically according to price, number of products remaining or category promotion.
4. Develop your Audiences :
Your audiences are the key to your success, and an essential performance lever.
Create audience pools with users who search for your products in advance, and retarget these lists during the sales period.
Check that your audience lists are present in all campaigns.
Adjust bids for your audience lists and customize your ads.
Gone are the days when you reduced your visibility on mobile because conversion rates were too low. Not ensuring your presence on mobile would be a mistake!
With 34 million mobile users connecting to the Internet every day on their smartphones, we have well and truly entered the mobile era. At the end of 2018, France had 3 million more mobile users than in 2017 We’re no longer talking about “Mobile-first” but “Mobile-only”… This domination of mobile is only getting stronger.
Make sure you have a strong mobile presence! It’s essential to increase the presence of your Search and Shopping campaigns on this device.
7. Keep an eye on your competitors’ promotions:
React to the competition for each product.
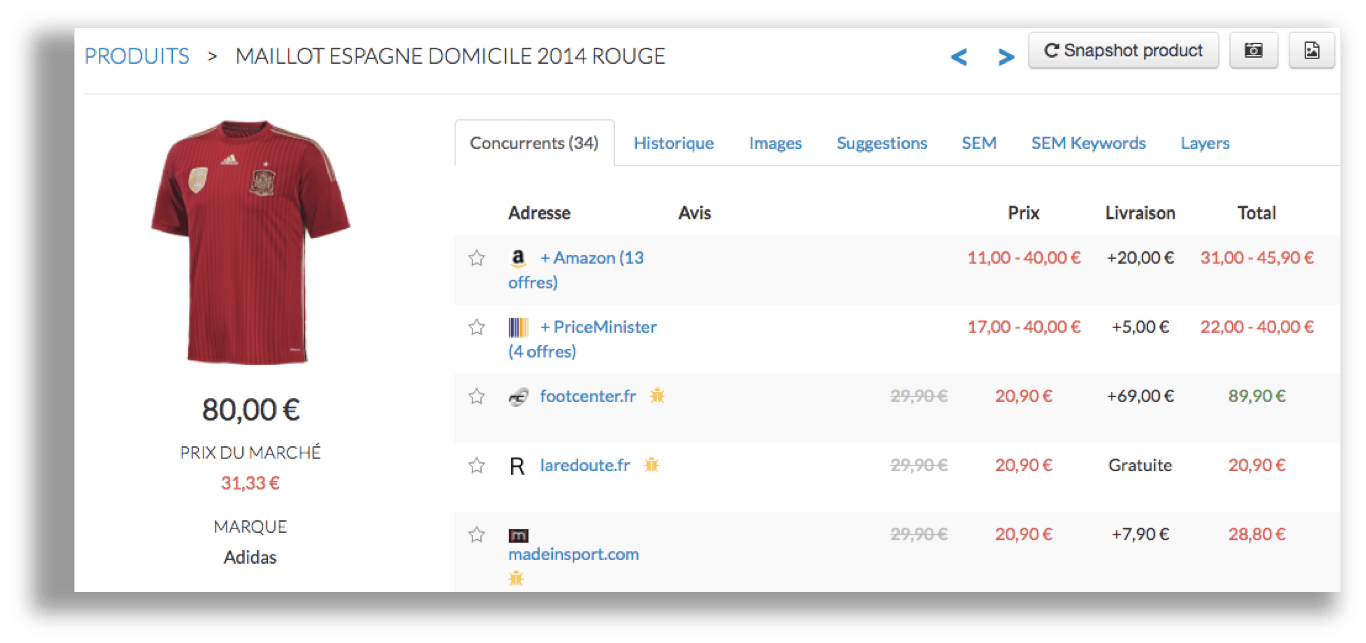
With Price Watch solutions, you can find out your exact price position in relation to a competitor, brand or category.
You’ll also be able to see which products are poorly positioned with just one click.
Ecommerce price watch
Adenlab
You can create personalized alerts to track your competitors’ price changes. For example, you could be alerted by email as soon as Product X on Amazon becomes 10% cheaper than you.
Adenlab is a SAS company with capital of €100,000.00, registered 852 682 921 with the Paris trade register and headquartered at 41, rue des jeûneurs – 75002 Paris.
In accordance with the French Data Protection Act n°78-17 of January 6, 1978 and its implementing decrees, , any person requesting a demo has the right to access, modify, rectify or delete any personal data concerning him or her. This right may be exercised by contacting Adenlab at the following address: contact@adenlab.com.
Google Shopping campaign: Performance depends on 2 key levers:
1. Bid adjustment or bid management 2. Relevance and quality of data provided in the product flow
Successful Google Ads campaigns, and especially Google Shopping campaigns, are a priority for Ecommercants. At Adenlab, SEA agency, Shopping campaigns have always been the driving force behind our optimizations and tool developments.
Audience targeting parameters, catalog management for flow optimization and product campaign management (shopping, search, display and Youtube) are winning combinations.
We talk a lot to our customers about targeting and audiences, because it’s vital to get your ads in front of the right people, at the right time, in the right place.
In this article, however, we’re going to look at the “data quality” of the stream and concentrate on the elements – or rather the attributes – of the stream.
This will enable you to gain relevance on Google Shopping and improve the performance of your Google Shopping campaigns.
Improving flow data has a direct impact on :
Your click-through rate (CTR): CTR increases are expected Your cost-per-click (CPC): CPC decreases are also possible Your return on investment (ROI ): ROI increases are possible
⇒ **Quiz before you start **: How many attributes are there in a Google Shopping feed? There can be up to 46 attributes in a feed! And yes, that’s a lot 😉 and not all of them are compulsory or useful: it will depend on the type of products you sell and your business sector.
However, we’re not going to review all 46 attributes, but rather focus on best practices that will help you achieve better results. Bid management will be covered in another post.
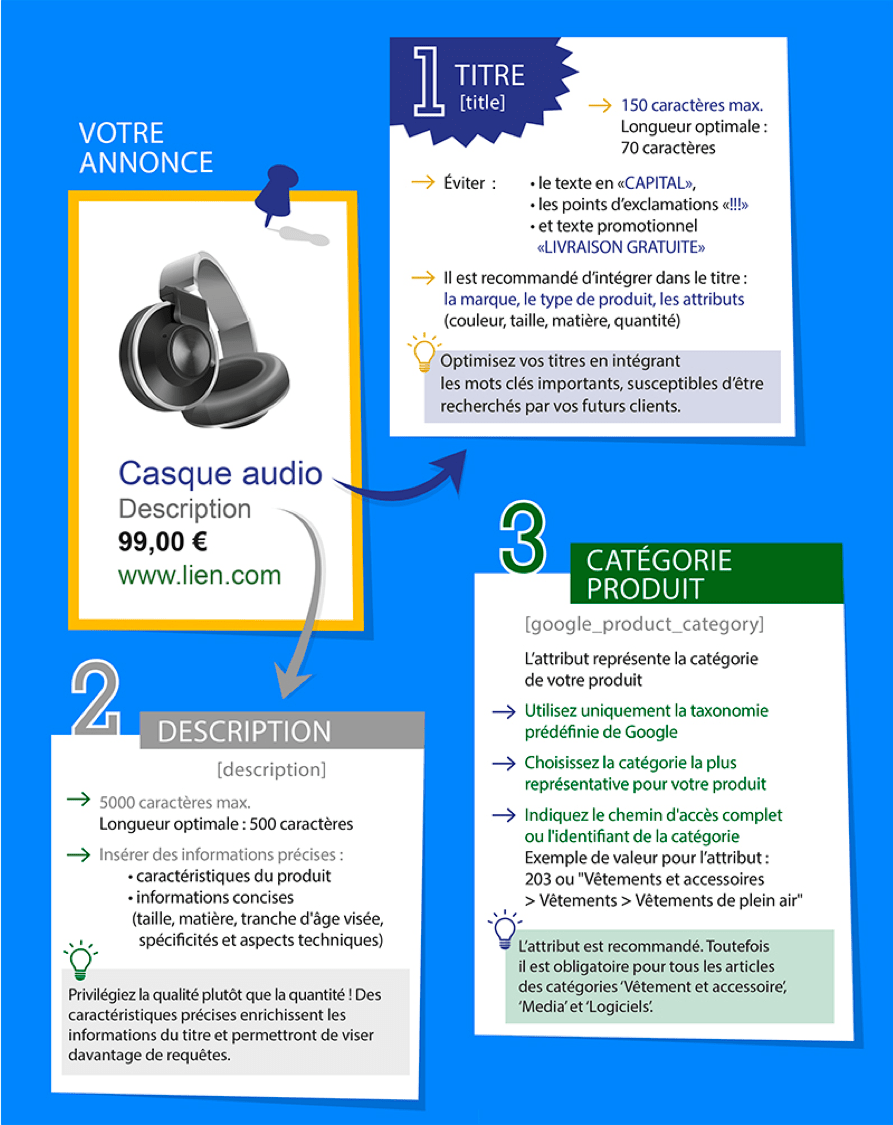
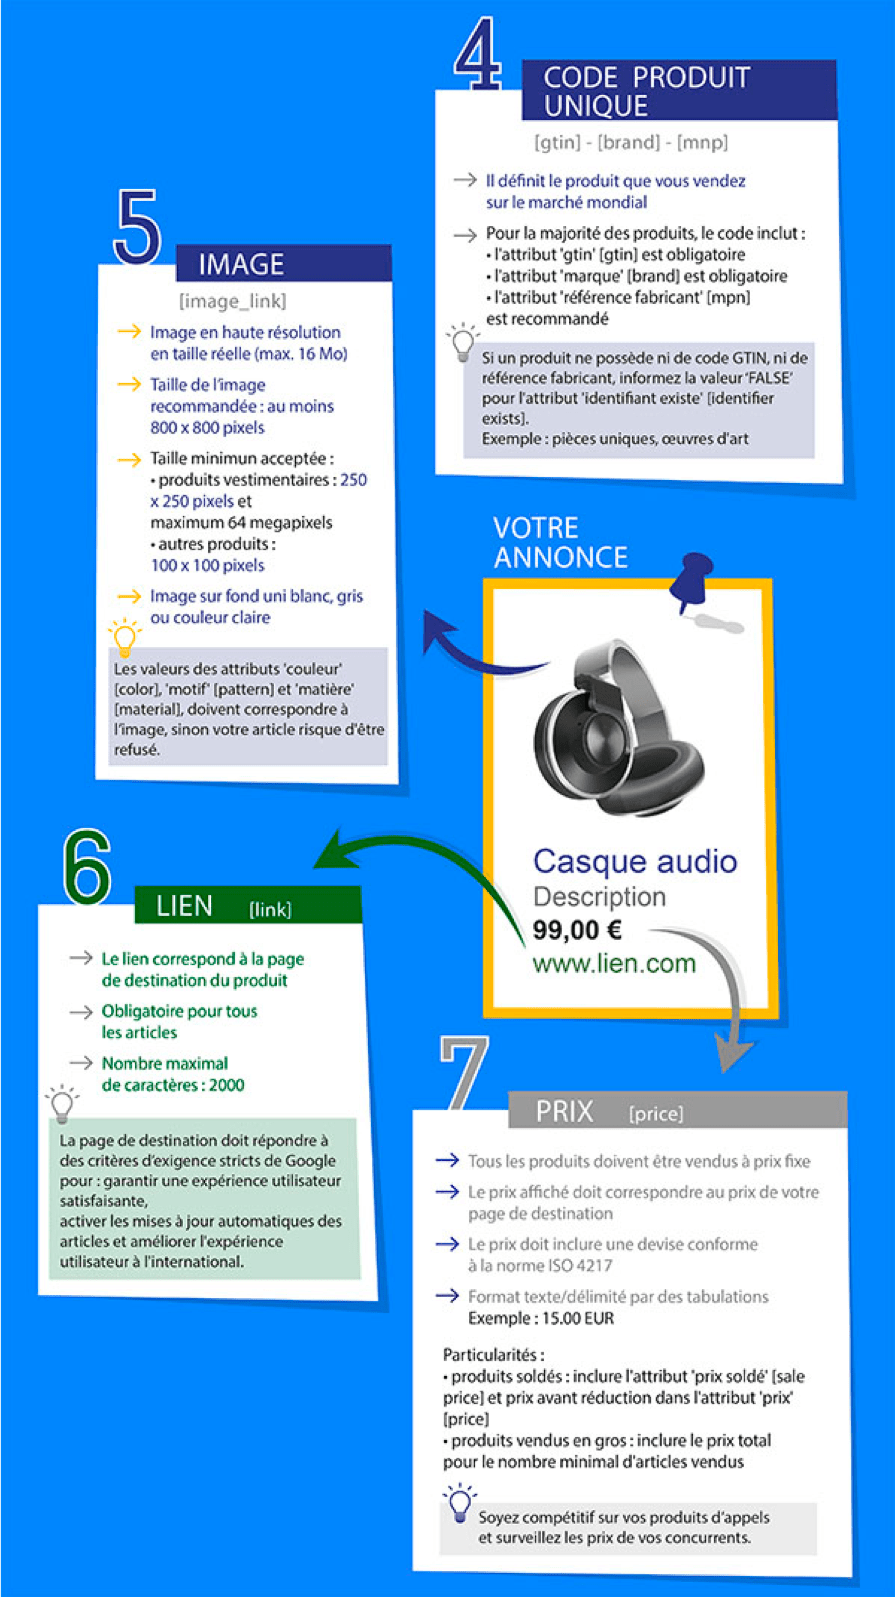
Maximize the number of feed attributes Careful Titles and Descriptions Specify Product Category Use Quality Images
Product title
The title of your product is certainly the most important attribute; improving your title is one of the top priorities of feed optimization.
Include the Top Keyword: In fact, the main term or keyword on which you want to position yourself should be present in the title, and rather at the beginning of the sentence.
Include the product type: if your product is a “knife sheath”, include this term in the title. This is rather obvious, but also very useful, because by including the product type in your title, you’re describing the very product you’re selling.
Color, brand, size, gender: these are elements found in other feed attributes, but which can be added to the Title. In fact, having a Title that’s as close as possible to your customers’ searches will enable you to position yourself on more precise terms.
The limit is 150 characters for a Title: so be as detailed and precise as possible.
Working on the optimization of your Titles can considerably increase your impressions and visibility!
Product description
Although the description is not very often visible to web users, it plays an important role in your feed. In fact, the description (up to 5000 characters) will enable you to complete the information in the Title and thus work more on the long tail and more precise queries.
Precision: although you can include a lot of content in the description, the aim is above all to be concise and precise; a clear product description will be the most effective.
Keywords and searches: think about the keywords your customers will search for to find your product; these terms must be included in the Description.
Google Product Category
Google has created a list of product categories and sub-categories, allowing you to “classify” each product in your catalog. This feed attribute is recommended but mandatory in certain sectors;
Use Google categories from among the +6000 categories and sub-categories. You can download the Google taxonomy here
Choosing the right category: to gain in quality, it’s always in your interest to be as precise as possible when choosing your category.
The images
Images are one of the most important factors! In fact, they’re the 1st element your future customers will see before clicking on your ad. Your photo must be attractive and realistic;
Light background: Google requires the product photo to be set against a light background; in general, a white background is best.
Image size: 800×800 pixel images are recommended. The minimum is 250×250 pixels for clothing products and 100×100 for other products.
No text or logo: only the product image should be visible; don’t add promotional text to your image
More recently, Merchant Center has introduced an automatic image enhancement option. You can activate this setting in your Merchant Center account at: Click on the Tools icon (the wrench at the top right of your account) > Settings > Automatic Enhancement For more details, follow theMerchant Center help linkhere.
Automatic price updates
Enable price and availability updates in your Merchant Center account so that Google can update your items based on the structured data markup we find on your website.
Problems such as latency between updates on your website and updates to your data sent to Google Shopping can result in inaccurate or out-of-date product data. Check the current structure of your microdata using the structured data test tool.
To go further in optimizing your flow, we also recommend that you read our article on the 5 steps to [optimiser votre Catalogue et votre flux Google Shopping](/news/optimizing-your-catalog-for-this-final-sale/).
CONCLUSION
Flow optimization is not simple, and requires several stages of analysis:
Attribute analysis
Analysis of errors identified by the Merchant Center
Analysis of user searches and keywords
Identification of potential/priority products to be optimized
Technical flow optimization
Optimization of titles, description …
At Adenlab, we’ve developed a strong expertise in Brand & Ecommerce catalogs, both on the Analysis aspect, as well as on the optimization of flows and the management of Google Ads campaigns for Ecommerce; Our SEA Agency is specialized in Ecommerce account management.
Our solutions make it easy to integrate our customers’ competition, increase product visibility across their entire catalog, and boost the performance and ROI of Google Ads campaigns thanks to our predictive and automatic algorithms.
Discover the secrets and powers of specialized audience lists for E-Commerce: add value to your blog, optimize conversions for certain profiles, identify new pathways, etc.
An audience list is made up of people who have shown interest in your products. Thanks to cookies deposited on their browsers, you can track these prospects and remarket (retarget) them online.
Google AdWords audience lists enable you to target the prospects most likely to convert – and therefore optimize your AdWords budget.
Creating a 5-point audience list.
Creating an audience list takes just a few simple steps in Analytics :
Log in to your account
2. Click on Administration > Property where you wish to create the
3. Then click on Audiencedefinitions > Audience in the Audience column .Property
4. Click on + New audience type
5. Enter the parameters for your audience type.
5 high-potential audience types for e-commerce.
Cart abandonment by traffic source: sorting your cart abandonments by traffic source allows you to increase the conversion of each, while analyzing those that convert the most.
Visits during working hours / outside working hours: this segment enables you to better target visitors by displaying your ads at the best times.
Conversions by number of visits: this segment shows you the number of visits required for each of your conversion objectives.
Higher engagement rate: people with a higher engagement rate than the average visitor are more likely to convert.
High-Value Customers: these are your customers who spend 2 or even 3 times your average shopping basket. Understanding their behavior allows you to better target them in your acquisition campaigns, while optimizing your site to encourage other visitors to act like them.
To go even further and become a Google Analytics ninja, we strongly recommend that you set up Google Analytics Conversion Funnels; In our article “How to set up conversion funnels in Google Analytics” you will be guided, step by step, and become a champion of conversion rate optimization!
Conclusion
Audience lists are very interesting growth levers. By setting them up, you can increase your conversions while optimizing your Google Ads budget.
For several years now, Adenlab, a Google Partner Premier SEA agency, has specialized in managing Ecommercant campaigns, making the most of audience parameters, the catalog and its product flow, and automation.
As I began this article, I thought it would be interesting to review the evolution of Google’s SERP (search engine results) and talk about the major changes of recent years.
In the end, however, I thought it more appropriate to review the information and show how Google is adapting its search engine to the growth in mobile traffic and the behavior of Internet users when searching for “products”.
All these developments naturally have an impact on campaign management, advertisers and their performance …
Part 1: Adapting SERPs to mobile behavior and traffic
With 34 million mobile users connecting to the Internet every day on their smartphones, we’ve well and truly entered the mobile age.
At the end of 2018, France had 3 million more mobile users than in 2017.
We no longer speak of “Mobile-first” but of “Mobile-only”… This domination of mobile is only getting stronger.
With this information, it’s easy to understand Google’s need to adapt and harmonize its search engine results for both mobile and desktop users.
1. Displaying Adwords ads :
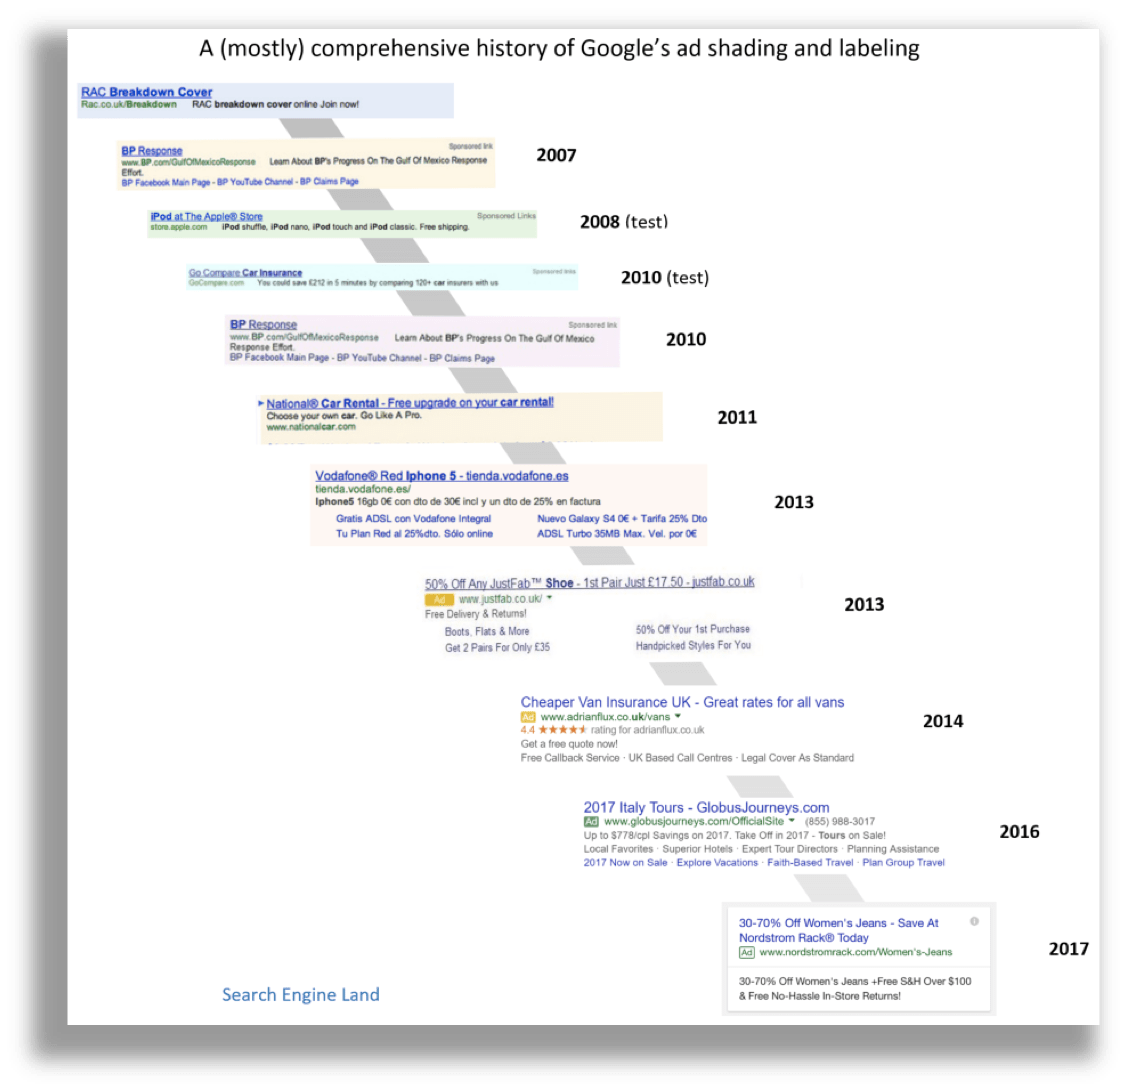
For several years now, Google has been testing and changing the way paid ads are displayed.
During 2013, a major change took place in the display: paid ads, until now identified by an orange-pink colored background, were no longer! The colored background disappears, and only a yellow tag with the word “Ads” appears next to the ad.
The timeline below illustrates the evolution of Google’s operations over the last few years.
The display changes, visible above, have had an impact on user behavior and on the performance of sponsored links.
In fact, a recent study showed that over 55% of Internet users who consult Google do not distinguish between sponsored and free links. Summary of the Ofcom study I leave you to draw your own conclusions 🙂
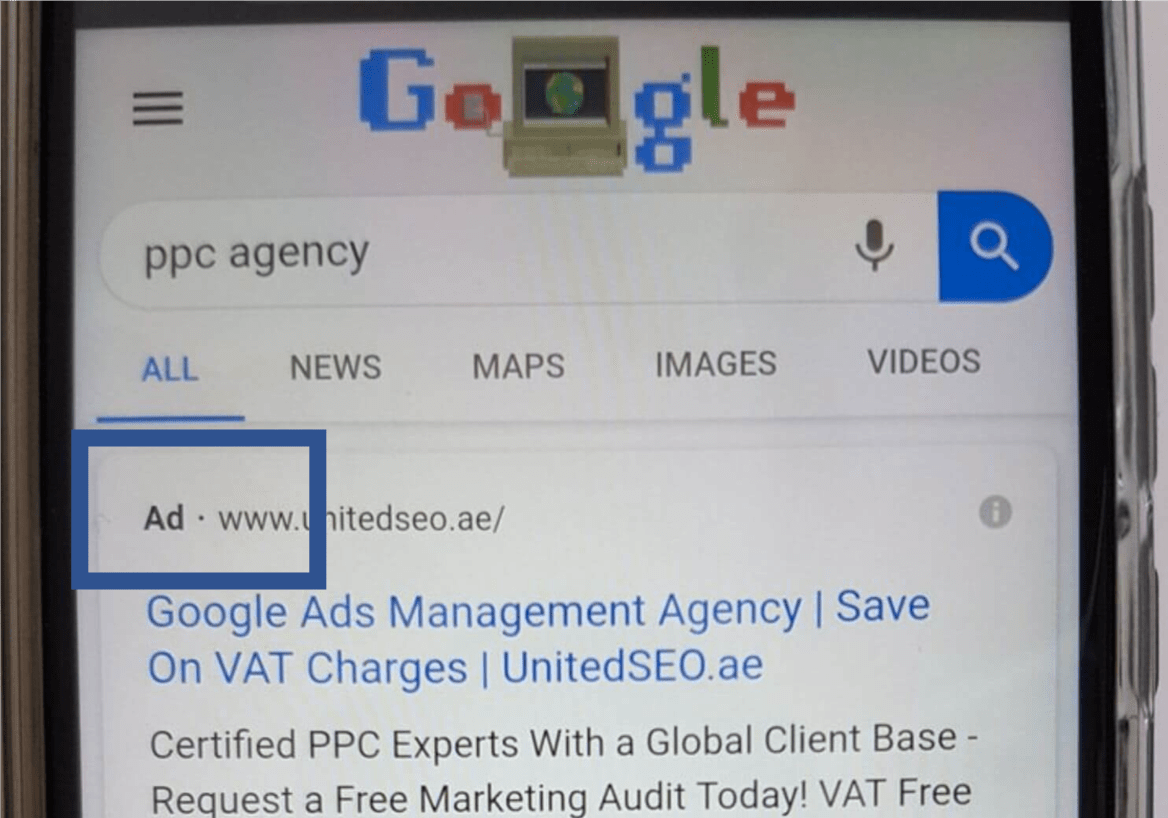
Which display for 2019?
Since 2016-2017, Google has been displaying its ads with the label “ads” or “annonce” in green.
It looks like something new is coming to the ad display this year.
Some tests are underway in the UK with a black display. This information was published on the Search Engine Land blog.
It may only be a test run, but we’re expecting change.
2. Remove side ads
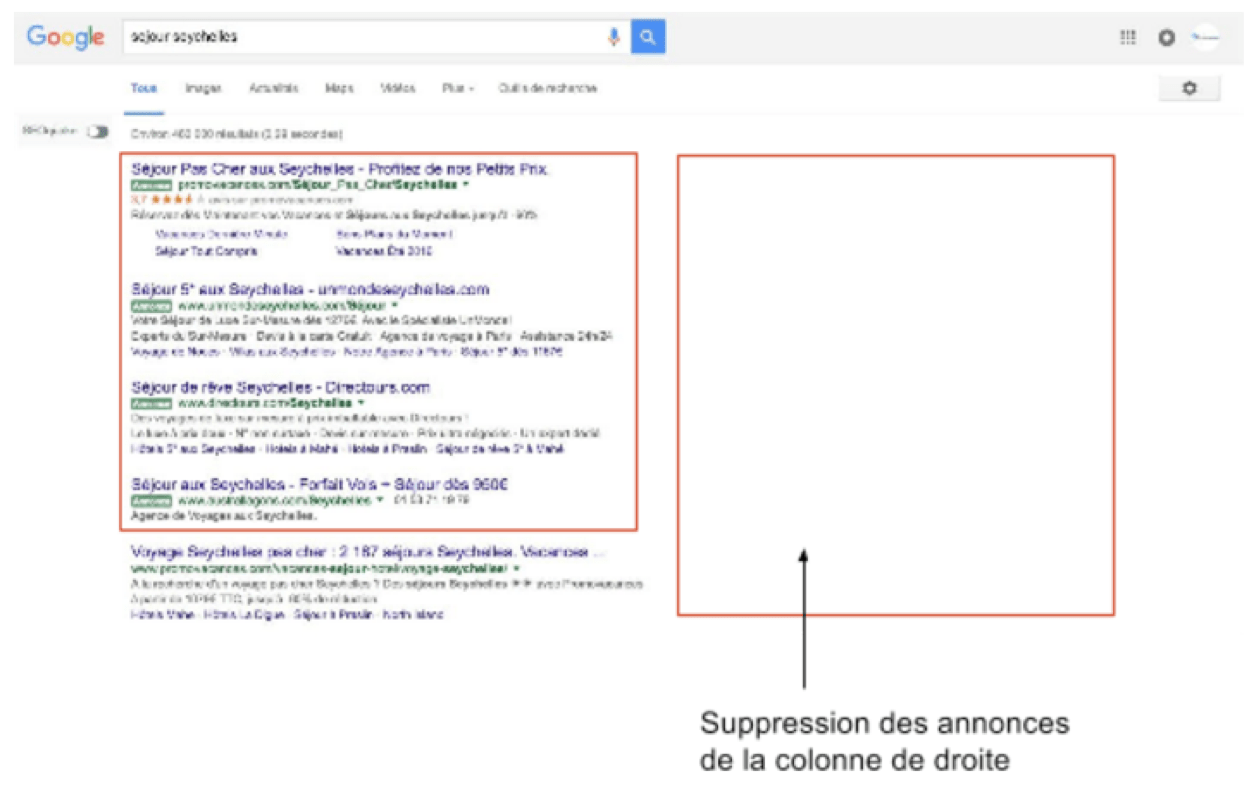
As of February 2016, Google removed Adwords ads from the right-hand column of the SERP.
This removal was accompanied by the introduction of a fourth ad link in the “VIP square” at the top of the page. Two exceptions:
Google Shopping ads gain visibility on the right-hand column The Knowledge Graph
So from the 11 ads initially visible on a page (3 ads at the top of the page and 8 ads on the right-hand side of the results), we now have 7 ads visible in the results (4 ads at the top of the page and 3 ads at the bottom of the page).
Example of display on query “Seychelles stay” (to dream a little ;))
Google Ads text ads
This change of display is in line with the harmonization of the engine’s results on Desktop and Mobile, since cell phones were not displaying the right-hand columns in their results.
On the Desktop, Shopping campaign ads benefited from this space to display more products.
The same applies to the Knowledge Graph, which is also displayed in the right-hand column.
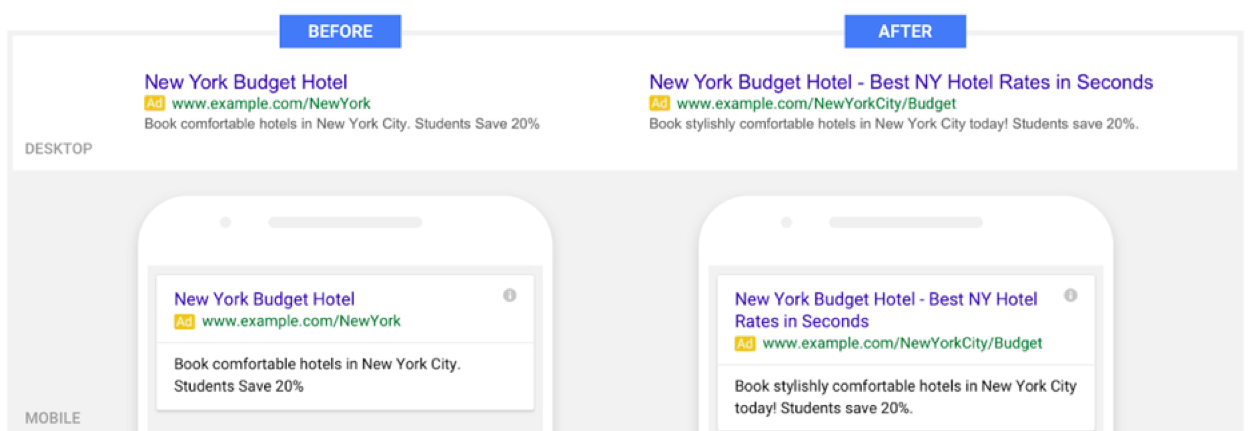
3. Expanded Text Ads (ETA)
The ETA format was an important change, allowing longer ads to be shown on all devices (computers, mobiles, tablets):
Historically, “classic” ads were structured as follows:
An ad title of 25 characters maximum A first description of 35 characters maximum A second description of 35 characters maximum A displayed Url of 35 characters maximum
What’s new?
Second title line added (30 characters each) Description lines merged (80 characters) Customizable URL displayed (2 customizable fields of 15 characters each)
That’s a total of 170 characters; however, it’s the pixel size that counts for the display and length of the ad: a capital “M” is not the same size as a lowercase “m”, so your title may be “cut off” if the ad size is too large.
At the time, Google announced the results and benefits of this ad format:
A title that takes up more space to better showcase your products and services Up to 50% more space for your ads (computer and mobile) Up to 20% more CTR
Once again, the reasons given by Google for this major change: mobile.
Indeed, more than half of all searches are now carried out from a mobile device. The objective was to harmonize ad formats and display in search results.
Mobile Mobile Mobile… that’s one obvious conclusion I can draw from the changes we’ve made. For e-tailers, these changes have an impact not only on AdWords campaign performance, but also on budget allocation.
As a reminder, spending by advertisers on Google is still on the rise, and search (sponsored links, paid referencing) is the No. 1 item in the digital mix, accounting for 45% of online advertising spend (21st Observatoire de l’e-pub).
Search marketing is still dominated by Google, which accounts for almost 93% of search engine queries in France.
35% of purchases were made on cell phones in 2018 (+22% on 2017)
The second part is devoted to the major changes Google is proposing to the Shopping experience.
Part 2: Evolution of the Shopping Experience on Google
In 2014, Google had announced a change in its algorithm with what was called “Mobilegeddon” in favor of mobile/responsive sites in natural search (SEO) results;
A move designed to encourage e-tailers to speed up their transformation to more “mobile” sites, in the face of ever-increasing mobile traffic.
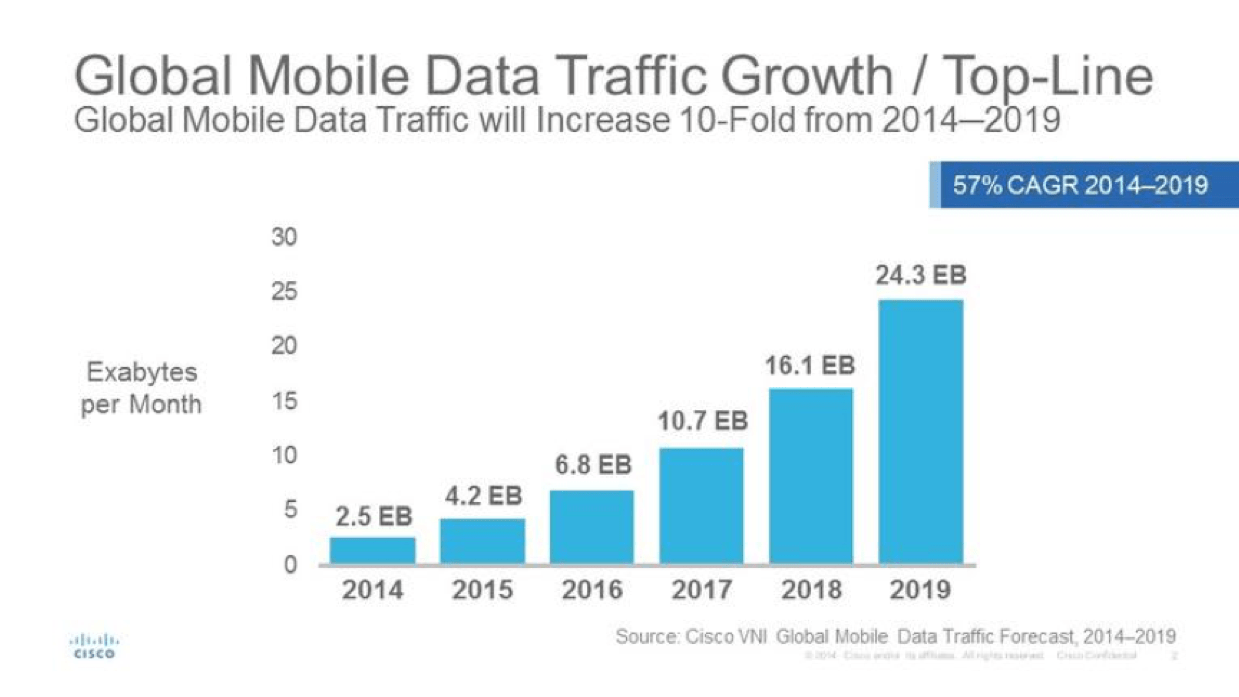
If we go back to Cisco’s forecasts for mobile traffic, it became essential for e-tailers (and Google) to adapt to the new uses we make of our “phones”…
Cisco’s forecasts were clear: worldwide mobile traffic will increase by a factor of 9.2 (between 2015 and 2020), at a rate of 56% per year.
In fact, to force the march towards mobile, in 2014 Google launched the “mobile-friendly” label; the label is displayed in mobile search results, signaling to the surfer that the link’s web page met the criteria established by Google.
In the same move (May 2015), and a little more radically, it’s Google’s algorithm that favors “mobile” sites in natural results.
It’s the “Mobilegeddon”: the name given to the algorithm update in favor of “mobile friendly” sites. This update would have enhanced the natural results of 4.7% of “mobile” sites.
For many e-tailers, it has been difficult to assess the impact of mobile traffic on sales, as the volume of direct transactions remains lower.
It’s even harder to understand (or accept) when this traffic is paid for.
For a large number of sites, the situation remained the same: growing mobile traffic, but too few conversions…
As a result, Google has come up with new advertising formats that are supposed to be better adapted to the product searches and shopping moments of Internet/mobile users.
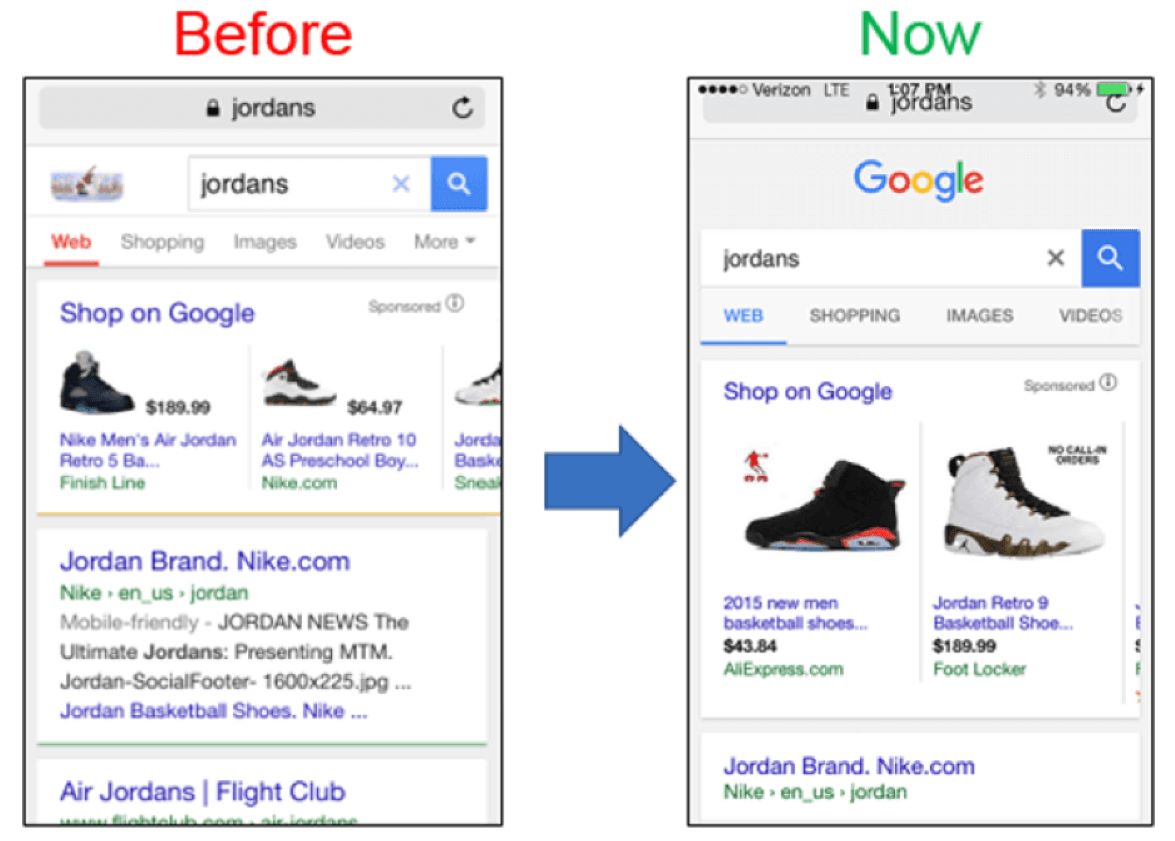
1. Shopping ad format on mobile: before/after
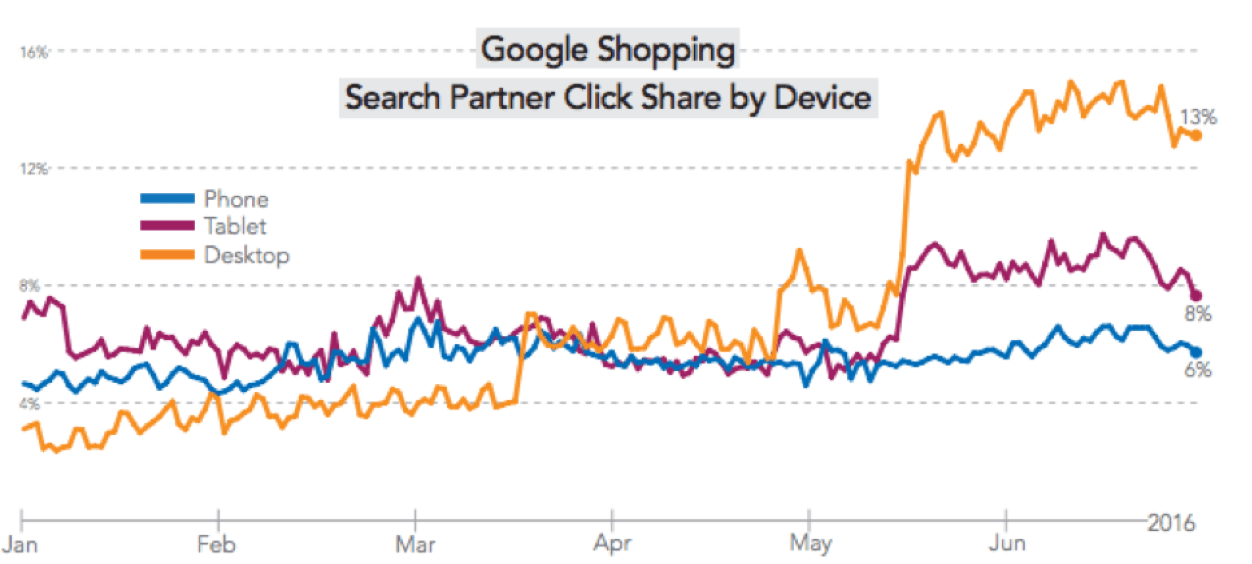
Here’s an overview of the evolution of Shopping ads on mobile. The results are clear: more space for Shopping ads with larger images. These changes are having an impact on advertisers’ budgets and traffic.
Clicks on Shopping (Mobile) ads increased by 193% Q1 2016 in the US (Q1 Digital Marketing Report by Merkleinc).
To build on this momentum, in May 2016, Google announced that Shopping ads would also appear in the engine’s “Images” results.
Since then, click volume has jumped significantly on the desktop: +13%.
evolution Google Shopping ads
2. Showcase format for Shopping Campaigns
The simple fact is that 40% of shoppers’ Google searches are generic, vague searches.
Example: A search such as “sports shoes”, “evening dress”, “bedroom furniture”.
This type of imprecise search generates a lot of traffic (and acquisition costs). If I were an e-merchant, I wouldn’t want to pay too much for this type of prospect, who I imagine is still a long way from making a purchase.
On the other hand, I want to make sure that Internet users looking for a specific product can consult my offers.
During the “generic” search, you and I want to consult a wide range of products to find ideas or direct me towards a product that meets my needs.
Example: The dress I’d like to give my wife for her birthday, I think I’m going to shop around to make my choice.
However, today’s Shopping ads are much better at answering specific queries, and are less attractive to undecided Internet users.
In this example, there are several stages in the search for and use of the “Showcase”:
I search for “mirror” on Google
Google displays several “Showcases” per advertiser
I click on the advertiser, here Home Decor.
All Home Decor “mirrors” are displayed.
The “Showcase” format seems to meet my need to browse and choose from online store catalogs.
And for e-tailers, paying for clicks from more qualified prospects.
3. Mobile price extension
Last but not least … July 2016, Google introduces the price extension. The aim of this extension for mobile text ads: to attract ever more qualified leads, by adding information about the price ranges of your products and services.
With this type of extension, we can “imagine” that Google has taken inspiration from e-tailers’ Shopping campaigns, which overall have higher conversion rates than text ads.
It’s also a way of discouraging buyers who don’t want to buy your products or services at the prices you charge.
Google Analytics provides a wealth of information about your online presence. There’s just one condition: set up your analytics account properly beforehand.
Who wants to make decisions based on incomplete or inaccurate data? In this article, we take a step-by-step look at how to set up Google Analytics correctly.
Let’s start with the mistakes that are regularly made when setting up Google Analytics. Even if your business is unique for many reasons, you can start by following these tips, which apply to all sites, including your own 🙂
1. Check that the tracking code is correct and complete
The tracking system is at the very top of the list of configurations that need to be set up correctly. Without it, you run the risk of missing out on key data on existing conversion stages on your site.
Tools for checking your configuration
There are various tools you can use to check your analytics configuration and make sure everything’s running smoothly.
Tag Assistant: perfect for checking configuration and resolving detailed problems at “page” level.
Tag Assistant is a Chrome extension that can be used to validate and diagnose your Google Analytics data on a page-by-page basis. Once you’ve solved a problem, you can return to Tag Assistant to check that your tags are working properly.
Screaming Frog SEO Spider: ideal for detecting site bugs across all pages. This tool is perfect for finding out whether your tracking code is correctly installed on all your pages.
There are two versions available: a FREE version, for websites up to 500 URLs, and a paid version, for more than 500 URLs.
Your tracking code At the very least, you should check two things with regard to the tracking code installed
Tracking code version: if you haven’t already done so, make sure you switch to Universal Analytics. Tag Assistant will display the version you’re using and whether or not you need to migrate.
**Code location **: where to place your tracking code depends on whether you use Google Tag Manager or not.
It is increasingly recommended to use Google Tag Manager for tracking configuration.
Getting the code implementation right (according to your tagging plan) is a crucial step in getting reliable information from Google Analytics.
2. Setting objectives
Setting up Google Analytics objectives is a crucial step in data analysis. Without these objectives, you won’t be able to find out why your site is working or not, and where you can improve.
Objectives are generally based on form validations, downloads or purchase completion.
If your site is primarily dedicated to lead generation, it’s important to set your objectives on the form validation pages.
For e-commerce, conversions are essentially measured by the validation of a product sale. Tracking is specific to e-commerce.
It is obtained by integrating a few extra lines of code into your site.
By default, Google Analytics lets you configure up to 100 accounts, 50 properties per account and 25 “views” per property. Multiple views are strongly recommended.
You should always configure a raw data view. Read this article if you’d like to know more about configuring different views in Google Analytics.
No matter how experienced you are, you need to have a backup view in place. Very often, there are several people working on the same Google Analytics account.
Make sure that NOBODY modifies the raw data view.
4. Integrating Google Analytics with other products
Google Analytics provides great integrations with a host of other tools. And you should use these integrations to your advantage! There are two basic integrations that are a must for every site owner.
Google Ads links
Everyone should create a Google Ads account, even if you don’t intend to run a campaign. You don’t need to have an SEM budget to open an account. Once created, you can use the “keyword research” tool, offered free of charge on the platform. Linking Google Analytics and Google Ads is easy. This way, you’ll see a wealth of useful Google Ads data in Google Analytics. What’s more, you can import Google Analytics goals into Ads and work more effectively with remarketing lists.
Google Search Console links
A few months ago, Google announced further integration between Search Console and Google Analytics. In short, by integrating Search Console and Google Analytics, you’ll get organic search data directly into Analytics. Search Console is just one integration among many. Do a Google search and you’ll find many other useful integrations relevant to your business.
5. Working with clean data
Whether you’re in charge of a small site generating few leads or a behemoth, you still need to clean up your data! Here are four tips for obtaining more reliable data
A. Use filters
Three things to do before you start optimizing your analytics account.
Save a blank version of the raw data “view” (“rescue view”). This will enable you to retrieve all the information related to your site in case your other “views” become buggy.
Create a test “view” in which you can carry out all your experiments. Test view with only your traffic included. Main view in which you’ll apply all the filters that seem relevant to you and that you’ve tested beforehand. We already recommend that you use the following two filters, which are essential for getting started with Analytics:
Exclude your IP addresses from your main “view”. Apply the “lowercase” filter to your “hostname”, “URI request”, “Search Term” and “Campaign Dimensions”.
Create a hostname-based filter with the domain name(s) you wish to analyze.
B. Using campaign branding
By default, Google Analytics correctly measures four different types of traffic:
Direct traffic. Organic traffic. Referrals. CPC (AdWords) – only if you have correctly integrated AdWords with Google Analytics.
But what if you’re running affiliate or e-mail campaigns? In this case, you’ll need to use Google Analytics’ campaign tracking functionality.
To help you build your campaign landing page URLs correctly, URL generators are available.
To better understand your acquisition channels, download our detailed study of Google Analytics Attribution and Ecommerce Sales.
C. Exclude technical query parameters
As far as Google Analytics is concerned, you can distinguish between the query parameters used on your site and the Technical & Analysis / Marketing query parameters.
On the one hand, there are URLs that contain no value in your analysis. For example, duplicate “session ID” pages.
If you don’t manage the “session ID” parameters correctly, you risk ending up with reports containing dozens of URLs that should be grouped under the same URL.
On the other hand, there are URLs that absolutely must not be excluded from your data, such as form submission validations. Check that these are present in your Analytics.
To cut a long story short, make sure you fill in the “Exclude URL query parameters” field with your URLs that are skewing your data, and check that all others appear in the reports.
By forgetting to exclude query parameters such as session IDs or other technical parameters, you’ll duplicate your content reports and make them much harder to analyze.
In this case, your data is distorted because it is duplicated.
To support you in your acquisition strategy, Adenlab has developed data-driven solutions that allocate Google Ads bids, by product, and according to economic parameters.