Optimize your feed for Google Shopping

Google Shopping campaign: 2 key levers for performance

1. Bid adjustment or bid management
2. Relevance and quality of data provided in the product flow

Successful Google Ads campaigns, and especially Google Shopping campaigns, are a priority for Ecommercants. At Adenlab, a SEA agency, Shopping campaigns have always been the driving force behind our optimizations and tool developments.

Audience targeting parameters, catalog management for flow optimization and product campaign management (shopping, search, display and Youtube) are winning combinations.

We talk a lot to our customers about targeting and audiences, because it’s vital to get your ads in front of the right people, at the right time, in the right place.

( See also: Google Ads and Facebook Ads: How to ensure the success of your campaigns withAudience settingsand Remarketing

In this article, however, we’re going to look at the “data quality” of the stream and concentrate on the elements – or rather the attributes – of the stream.

This will enable you to gain relevance on Google Shopping and improve the performance of your Google Shopping campaigns.

Improving flow data has a direct impact on :

Your click-through rate (CTR): CTR increases are expected
Your cost-per-click (CPC): CPC decreases are also possible
Your return on investment (ROI ): ROI increases are possible

⇒ **Quiz before you start **: How many attributes are there in a Google Shopping feed? There can be up to 46 attributes in a feed!
And yes, that’s a lot 😉 and not all of them are mandatory or useful: it will depend on the type of products you sell and your business sector.

However, we’re not going to review all 46 attributes, but rather focus on best practices that will help you achieve better results. Bid management will be covered in another post.

Maximize the number of feed attributes
Careful Titles and Descriptions
Specify Product Category
Use Quality Images

Product title

The title of your product is certainly the most important attribute; improving your title is one of the top priorities of feed optimization.

  • Include the Top Keyword: In fact, the main term or keyword on which you want to position yourself should be present in the title, and rather at the beginning of the sentence.

  • Include the product type: if your product is a “knife sheath”, include this term in the title. This is rather obvious, but also very useful, because by including the product type in your title, you’re describing the very product you’re selling.

  • Color, brand, size, gender: these are elements found in other feed attributes, but which can be added to the Title. In fact, having a Title that’s as close as possible to your customers’ searches will enable you to rank on more precise terms.

The limit is 150 characters for a Title: so be as detailed and precise as possible.

Working on the optimization of your Titles can considerably increase your impressions and visibility!

Product description

Although the description is not very often visible to web users, it plays an important role in your feed. In fact, the description (up to 5000 characters) will enable you to complete the information in the Title and thus work more on the long tail and more precise queries.

  • Precision: although you can include a lot of content in the description, the aim is above all to be concise and precise; a clear product description will be the most effective.

  • Keywords and searches: think about the keywords your customers will search for to find your product; these terms must be included in the Description.

Google Product Category

Google has created a list of product categories and sub-categories, allowing you to “classify” each product in your catalog. This feed attribute is recommended but mandatory in certain sectors;

  • Use Google categories from among the +6000 categories and sub-categories. You can download the Google taxonomy here

  • Choosing the right category: to gain in quality, it’s always in your interest to be as precise as possible when choosing your category.

The images

Images are one of the most important factors! In fact, they’re the 1st element your future customers will see before clicking on your ad. Your photo must be attractive and realistic;

  • Light background: Google requires the product photo to be set against a light background; generally speaking, a white background is best.

  • Image size: 800×800 pixel images are recommended. The minimum is 250×250 pixels for apparel products and 100×100 for other products.

  • No text or logo: only the product image should be visible; don’t add promotional text to your image

More recently, Merchant Center has introduced an automatic image enhancement option.
You can activate this setting in your Merchant Center account at:
Click on the Tools icon (the wrench at the top right of your account) > Settings > Automatic enhancement
For more details, follow theMerchant Center help linkhere.

Automatic price updates

Enable price and availability updates in your Merchant Center account so that Google can update your items based on the structured data markup we find on your website.

Problems such as latency between updates on your website and updates to your data sent to Google Shopping can result in inaccurate or out-of-date product data.
Check the current structure of your microdata using the structured data test tool.

To go further in optimizing your feed, we also recommend that you read our article on 5 steps to [optimize your Catalog and your Google Shopping feed](/news/optimizing-your-catalog-for-this-final-sale/ before-the-sales).

Conclusion

Flow optimization is not simple, and requires several stages of analysis:

  1. Attribute analysis
  2. Analysis of errors identified by the Merchant Center
  3. Analysis of user searches and keywords
  4. Identification of potential/priority products to be optimized
  5. Technical flow optimization
  6. Optimization of titles, description …

At Adenlab, we’ve developed a strong expertise in Brand & Ecommerce catalogs, both on the Analysis aspect, as well as on the optimization of flows and the management of Google Ads campaigns for Ecommerce; Our SEA Agency is specialized in Ecommerce account management.

Our solutions make it easy to integrate our customers’ competition, increase product visibility across their entire catalog, and boost the performance and ROI of Google Ads campaigns thanks to our predictive and automatic algorithms.

Don’t hesitate to contact us!

Google Analytics Ecommerce Reports: 5 mistakes to avoid


Google Analytics is a powerful but complex tool. Discover the 5 mistakes you should avoid to optimize your analysis.

You can also download our Google Analytics study on the distribution of Ecommerce sales and how they are allocated according to acquisition channels here : Google Analytics Ecommerce Attribution

Analytics secrets: 5 mistakes to avoid with Analytics.

Analytics, as its name suggests, is based on data analysis.
It’s essential that your account is set up properly.

Used by a machine learning solution, data enables you to optimize your bidding strategy simply and easily.

Conversely, inaccurate data will distort your results.
Here are 5 mistakes to avoid with Analytics.

1. Your payment platform is counted as a referral site.

When it’s time to pay, your customers are directed to Paypal, Shopify, Payoneer (or other) before being redirected to your site.

Analytics counts this as a new session and your payment platform appears as a referral.

The solution? Add your payment solution to the list of sites to be excluded from your referrals.

Although ROAS and ROI (Return on Investment) are often used interchangeably, they differ.
ROI takes into account overall costs, while ROAS focuses solely on advertising investments. ROAS is therefore better suited to evaluating the effectiveness of Google Ads campaigns.

2. Your tracking code is partially installed on your site.

If your visitor navigates between listed pages (your pages that convert) and unlisted pages, his or her journey is broken down into several smaller sessions, resulting in erroneous results.

Use GA Checker to check that your tracking code has been installed throughout your site.

3. Your company's IP address is not filtered.

Who visits your site most often? You do! These sessions should be excluded, as they are not representative of your customers’ behavior.

All you need to do is filter the IP addresses of your company, your service providers and your employees, if they work from home.

4. Robots are not excluded.

Robots – whether acting on behalf of search engines or malicious entities – regularly scan your site.

If their sessions are counted, they report high bounce rates and very short visit times.

Check that the “Robot filtering” option is enabled in your Analytics account (Administration > View, View settings).

5. Important events are not documented.

Promotion, launch, redesign of a page’s UX, etc. are all important events to take into account in your follow-up.

The annotations available in Analytics enable you to measure the impact of these actions on your results. Would you like confirmation that your Analytics data is not distorted?

We carry out an audit of your account before the start of each campaign to check the quality of your data.

Have you ever thought of using a Machine Learning solution to improve your performance? Contact us to find out more!

CONCLUSION

If you need help with your tagging plan oroptimizing your Analytics accounts, contact us, we’ll be delighted to discuss and implement the solutions you need;

Also, if you want to advance on your own and become an Analytics ninja, don’t forget to work on your Conversion Funnels; Check out our artilce “How to set up Conversion Funnels in Google Analytics“: you’ll be guided step by step; Happy reading!

Prepare your sales! How to make a success of your Google Ads, Shopping and Performance Max campaigns?

Your summer and winter sales are great opportunities to increase your sales volumes and reach your annual sales targets.

Anticipate and prepare your Google Ads campaigns to make them effective and profitable during these busy times of year. You can always call on a specialized agency, a Google Ads Certified agency, to support you.

The sales last 6 weeks, but as you know, the first week is decisive.

Research trends: "SOLDE" in France

Sales” queries start to rise 2 weeks before the start of the sales. The volume of products bookmarked on e-commerce sites starts to rise considerably 5 weeks before the start of the sales.

Increase your online visibility

Start increasing the visibility of your Shopping and Adwords campaigns 2-3 weeks before the sales. Take advantage of a less aggressive competitive strategy and low cpc.

Our predictive solutions make it easy and efficient to analyze our customers’ competition, increase product visibility across their entire catalog, and develop campaign performance and ROI thanks to our algorithms and automations.

Find out more…

Adapt your budget and increase the share of voice for your key campaigns

Thanks to our Machine Learning algorithm, we run simulations to identify the budget that will maximize the overall ROI of your Google Shopping campaigns.

Budget and Product Performance Simulator

Optimize the keywords and ads in your campaigns

  1. Develop your lists of keywords related to previous sales.
  2. Cover your entire catalog
  3. Maximize the impact of your ads. Rework and personalize your Text ads
  4. Check your ad extensions and customize them.

Adenlab ‘s solutions and our agency’s proprietary software create campaigns, keywords, ads and extensions easily and automatically.

They allow you to personalize your ads according to the elements (metadata) in your catalog.

Adverts can be updated automatically according to price, number of products remaining or category promotion.

Develop your Audiences

Your audiences are the key to your success, and an essential performance lever.

Create audience pools with users who search for your products in advance, and retarget these lists during the sales period.

Check that your audience lists are present in all campaigns.

Adjust bids for your audience lists and customize your ads.

Optimize your Shopping inventory

Optimize your Merchant Center flow well in advance. Here are a few tips

Prepare your Shopping Feed for the sales season with sale prices and promotion dates.

It’s advisable to prepare and update the Shopping feed at least 7 days before the sale to avoid rejected items.

During sales, update your feed as often as possible if you make price changes to your products during the day.

Google Merchant Center: How to leverage your data, from google shopping reports to shopping feeds

Increase your presence on Mobile

Gone are the days when you reduced your visibility on mobile because conversion rates were too low. Not ensuring your presence on mobile would be a mistake!

With 34 million mobile users connecting to the Internet every day on their smartphones, we’ve well and truly entered the mobile era. At the end of 2018, France had 3 million more mobile users than in 2017
We’re no longer talking about “Mobile-first” but “Mobile-only”…
This domination of mobile is only getting stronger.

Source: Webloyalty infographic (https://webloyalty-panel.com)

Make sure you have a strong mobile presence!
It’s essential to increase the presence of your Search and Shopping campaigns on this device.

Keep an eye on your competitors' promotions

React to the competition for each product.

With Price Watch solutions, you can find out your exact price position in relation to a competitor, brand or category.

You’ll also be able to see which products are poorly positioned with just one click.

Ecommerce price watch

Adenlab

You can create personalized alerts to track your competitors’ price changes. For example, you could be alerted by email as soon as Product X on Amazon becomes 10% cheaper than you.

And we can automate your visibility on Google Shopping based on competitor price data (in our Lab: Price positioning and Shopping campaigns).

Contact us

Our Shopping and Performances Max campaign experts are available to answer all your questions; you can also reach us directly on 01 83 81 90 60 or by e-mail: contact@adenlab.com

Dynamic Meta Campaigns – Facebook & Intagram // Problems and solutions

Creating a dynamic campaign on Facebook and Instagram: problems and solutions

If you’re an e-merchant and you want to ensure your visibility on Facebook, it’s probably because 35 million French people are registered there.

You’ll have several options for launching advertising campaigns on Facebook and Instagram. One of the most effective and ROI-saving is the Dynamic campaign. Dynamic ads are automatically served with images from your product feed.

Dynamic ads use the Facebook Pixel to show ads to people who have already visited your e-Commerce site and products.

See also: Guarantee the success of your sponsored campaigns with targeting, remarketing and your audiences

Here we describe the recurring problems and solutions we’ve brought to e-merchants when setting up and launching Dynamic campaigns.

We’ll take a look at two examples of errors that prevent e-retailers from running dynamic campaigns on Facebook and implementing an effective Remarketing strategy for their audience.

We assume that you have access to :
  • A Facebook Business Manager
  • Catalog in CSV or XML format
  • A Facebook Pixel installed on your site

Guide to Facebook Ads for Ecommerce
What is Remarketing?

It’s a process, or rather a marketing strategy, for delivering targeted ads to an audience that has visited your site or mobile application. In the case of our dynamic campaigns, the advertisements are images of products that have been visited on your site by the same users, who then browse on Facebook or Instagram: this is the remarketing or retargeting strategy.

Example of a mobile Facebook catalog ad

We won’t dwell on audience creation and targeting here. However, we do recommend that you read “The Guide to Facebook Ads for Ecommerce”, in which you’ll find several examples of audience creation. Indeed, to ensure a high Return on Investment, you’ll need to master the segmentation of your audiences and campaigns in your account.

What are the recurring problems?

When we set up a dynamic campaign for an E-Commerce business, we have to make sure that all the products in the catalog are integrated into the Business Manager…It’s also at this stage that we run into “problems”!

What are the recurring problems that prevent the creation and launch of dynamic campaigns?

We’ve listed below some of the errors we regularly encounter;
We imagine you’ve also encountered this type of error message:

  1. No products in the Facebook “catalog
  2. Rejected products in Business Manager
  3. The Pixel with the wrong settings
  4. Inability to launch remarketing campaigns

With this type of discouraging message, you’re still a long way from reaching your target audience. But with the tips below, you’ll be able to target the right audiences and develop your return on investment on Facebook.

How to resolve errors

Below are two technical cases with detailed resolutions. In the first case: all your products are rejected and in the second case: it is impossible to run dynamic campaigns because the products are not recognized by the Facebook Pixel.

Let’s get down to the nitty-gritty of creating dynamic and remarketing campaigns! And off you go to target advertising to a qualified audience!

We assume that you have access to :
  • A Facebook Business manager
  • Catalog in CSV or XML format
  • A Facebook Pixel installed on your site

Case 1: 100% OF PRODUCTS ARE REJECTED!

How do you go from 100,000 rejected products to 100% of the catalog being accepted? You’ll need to use the Facebook feed import rules

Case 2: MISSING PRODUCTS IN YOUR PRODUCT FLOW & PIXEL MATCHING ERRORS

Avoid missing identifiers in the catalog. Ensure that 100% of pixel events can be used for remarketing (view content).
Case 1: All products in the catalog are rejected

In this first case, when integrating the product feed into the Facebook Catalog, all the products were rejected. In the screenshot below, you can see that 141,005 products have been added, but none of them have been updated.

=> 100% of products are rejected !!!

Creating a feed can lead to an error-filled diagnosis. Fortunately, Facebook messages are a great help.

Sample error report

In the screenshot above, you can see that 141,005 products have been rejected and that 4 errors need to be corrected.

Here a mandatory field is missing for 4 attributes: “availability”, “condition”, “image link”, “link”.

FINDINGS

When we delved into the feed and its attributes, we realized that the “link” field didn’t exist, but that the “link” field did. Here’s a little subtlety we weren’t expecting! The Business Centre doesn’t translate automatically

The same goes for “availability”, which is present as “disponibilité”.

Facebook has not matched these attributes, which are the same but simply not translated.

We therefore have a feed set up in French in Facebook whose attributes are not recognized by the Business Manager.

SOLUTION

We’re in luck: Facebook’s feed optimization tool is easy to use and allows us to rework the feed without having to generate a new one.

In your Business Manager, in the “Catalog” section, “Product data sources”, select your feed, then the “Settings” tab.

Product data source

In the “Rules” section we can add transformations such as :

availability ->

The values change from “in stock” to “in stock”, and so on for each column.

In the cases below we have implemented a dozen matching rules to validate our flow:

Example of Facebook catalog import rules

You can see the progress by saving or restarting the feed import by clicking on “retrieve”.

Of course, it may not work the first time.

You’ll probably have more luck than we did; our catalog, in addition to being in French, is not in UTF-8 but in ISO-8859, creating other problems.

RESULTS

When we re-import the catalog, all 140,972 products are accepted.

All the products are gone!

There are still some caveats, but we can still use our catalog for our remarketing campaigns with dynamic ad formats.

Case 2: Pixel events are not eligible for catalog remarketing

When we talk about “pixel events”, and in our case “views”, we’re actually talking about visitors to your pages, and more specifically to your product pages.

In our case, all you have to do is look at the explicit Facebook messages to understand that there’s a problem somewhere.

FINDINGS

Below, Facebook tells us that we can’t retarget visitors to our site with dynamic campaigns because the products aren’t identified or rather “missing” from the catalog.

Event error indication

You can take a closer look at the list of events concerned.

The product pages are not actually linked to the “Catalog” we imported into the Business Manager.

Let’s open the product flow and see what’s going on.

Example of Pixel information versus product catalog

The IDs in the initial feed have a 2-letter prefix referring to the target country: here BE20563(highlighted in yellow) in the feed.

However, Facebook shows an ID without the prefix “BE” with only the numbers “20563”.

Facebook can’t find this pivot automatically

SOLUTION

Let’s give him a hand by using his feed transformation rules tool.

Facebook provides comprehensive feed optimization tools and recommendations.

Flow transformation rules tool

Here, we’ve added a new modification rule using a regex.

BE(.*) means we want to capture all characters after BE, this result will be automatically defined in $1.

In this example, we use everything after BE (which is our Pixel identifier).

This syntax may seem barbaric, but it’s a standard in computing: more info.

RESULT

Apply and watch the Facebook preview

Example of regex application preview in Facebook

Perfect! Our identifiers now look good.

All that remains is to wait for the new Pixel events to be assigned to the right product in the catalog.

Successful catalog import

Now that our 1127 products have been identified, we can start a new campaign!

#Hint# : the import was scheduled for 2 a.m., when the feed seemed to be generated. By delaying the import by a few hours, we waited for it to be fully generated before retrieving it to get all the products.

Example of catalog import time change

How can you implement all these elements if you don't have all this technical knowledge?

Finding solutions to a problem can take time and research.

In the example above, some solutions are simply not to be found on Facebook sites or other forums.

Our knowledge of product flows and our in-house software development for catalog optimization enable us to find solutions quickly.

In fact, if you’re experiencing this type of problem and need help, our expert Ecommerces developers and Traffic Managers are here to help. Our SEA agency Adenlab is a Google Partner Premier and Facebook Ads certified agency.

Google Ads – Analytics: under-utilized data


Every year, we are surrounded by more and more data.

This is an undeniable asset for companies: the analysis of this data enables them to optimize their marketing strategy.

Communicating with the right target, at the right time, with the right product: that’s the goal of every company today!

However, data is not always put to the best possible use. Companies exploit it, but the analysis remains too superficial to be fully effective.

In this guide, we’ll focus on 2 essential digital marketing tools: Google Ads & Google Analytics.

These high-performance tools enable companies to collect a vast amount of data, but the evidence is clear: this data is under-exploited.

First, we’ll explain what data you’re likely to collect with these two tools.

Secondly, we’ll give you tips on how to optimize the use of the data you get from Google Ads and Google Analytics.

What data does Google Ads collect?

If you own a website, especially an e-commerce site, you’re probably familiar with Google Ads.

With just a few clicks, this tool enables you to create advertising campaigns that appear in the SERPs: the results pages of the Google search engine.

Here, we’re talking about SEA, not SEO: the sites aren’t listed naturally, but through a bidding system.

In order to appear in a good position in the Google Ads inserts that are displayed each time a web surfer makes a query, ads must meet a number of criteria:

CPC, also known as cost-per-click: the higher a site’s CPC compared to its competitors, the greater its chances of appearing in good position.
Ad quality: certain rules laid down by Google must be respected by advertisers
Landing page quality: in particular, the landing page must be consistent with the subject of the ad.

For e-commerce sites, tracking Google Ads campaigns is essential.

Thanks to this tool, you’ll always know what each keyword, each ad and each campaign is bringing in and costing you.

Google Ads campaigns are optimized on a daily basis, to improve conversions and meet targets.

That’s why it’s essential to analyze the data obtained through the Google Ads tracking and management tool.

Here are some data that may be important for an e-commerce site looking to improve its conversions:

The click-through rate (also known as CTR)
The number of times the ad is displayed
The keywords used by web users who have purchased from the e-commerce site after clicking on a sponsored ad
The location of web users and their profile who have clicked on the ad

All this data can be analyzed. The most important is undoubtedly the CTR.

If, after analysis, you realize that the CTR of your campaigns is low, it’s because you need to optimize them: your ads display well in the SERPs, but web users click on them relatively little.

In such a situation, you’ll probably have to rethink your strategy: modifying the ad with a catchier or less advertising text may be a solution to consider.

What data does Google Analytics collect?

Google Ads isn’t the only tool for collecting data.

Google Analytics is just as essential.

However, it doesn’t work in the same way as Google Ads:

Google Ads lets you analyze the data obtained from your sponsored ads
Google Analytics lets you analyze the performance of your website through statistics

Note that these two tools can be combined, which is very useful for e-commerce sites.

But more on that later. First, let’s take a look at the data that can be obtained using Google Analytics alone!

Here is a non-exhaustive list of data you can collect and analyze with Google Analytics in addition to the number of visits and page views over a given period:

Data related to the website audience:

Demographics (age, gender, etc.)
Geography (language, country)
Site behavior (new or repeat visitors, frequency of visits)
Technology used (operating system, browser, mobile)

Data related to the acquisition of the website audience:

Traffic sources, referring sites…
Google Ads
Social networks

Data relating to the behaviour of Internet users on the website:

Most viewed pages
Viewing time
Bounce rate
Destination page
Exit page
Site speed
Site search
Data linked to conversions…. provided that objectives have been defined beforehand!

For an e-commerce site, this section must be parameterized: this will enable you to carry out a more complete analysis.

So, if you find that certain pages of your website have a very high bounce rate, it’s because the strategy in place isn’t the most optimal.

You’ll probably have to think about modifying the content of the page to make it more attractive or more in line with what web users are looking for.

Similarly, demographic data will help you to better understand the visitors you are attracting to your website.

If you realize that a target spends a lot of time on a category on your e-commerce site, you can take this into account when setting up Google Ads.

Analyze project performance by combining Google Ads and Analytics

If you use Google Ads and Google Analytics separately, it’s a good idea to combine the two tools.

In this way, you’ll be able to analyze the performance of your campaigns and e-commerce site in a much more detailed and comprehensive way.

In particular, you can retrieve cost-per-click data from Google Ads, as well as conversion data from Google Analytics.

By merging these two types of data, you’ll obtain unprecedented information that will enable you to make strategic decisions in the future.

So, for each conversion, you’ll know which product was clicked on and which was sold. In this way, you’ll be able to compare the gain from selling a product on your website with its cost.

All the data you obtain from combining Google Ads and Analytics will give you a better understanding of your website’s traffic and conversions.

This information is extremely useful for improving your e-commerce site and your Adwords ads: with the right data at your disposal, you can make strategic and optimal decisions!

But how do you combine these two tools? Find out how:

  1. Start by logging in to your Google Ads account

  2. Click on Settings, then choose “Associated accounts” from the menu.

  3. Display the details by clicking on “Google Analytics”. You should then see a list of all the Analytics properties you can choose to associate.

  4. Choose one of the properties. Click on “Configure association”.

If the selected property has only one view, its name appears. Then click on “Import site statistics”.

This is the step that gives Google Ads access to your Analytics data.

If the selected property has multiple views, the methodology is a little different. You can choose between 2 parameters. The one we recommend is the import of site statistics.

But you can also choose the second method, “Associate”. In the latter case, you can associate as many views as you like.

  1. Validate the information and repeat the operation for each property you wish to associate between Analytics and Google Ads.

Once set up, you’ll be able to import Google Analytics goals and transactions, view all Analytics data in Google Ads reports, and import Analytics remarketing audiences.

Of course, you can also view Google Ads data in your Analytics reports.

Personalized attribution models: a winning strategy?

You can go even further in analyzing the data provided by Google Analytics and Google Ads. This involves setting up personalized attribution models.

Are you unfamiliar with the concept? Here’s some information to help you make sense of it:

The personalized attribution model is a set of rules that the statistics tool (Google Analytics) automatically applies to assign conversions to the various channels, i.e. traffic sources on your website.

The attribution model allows you to monitor your website in a much more detailed way, which is particularly interesting for e-commerce sites.

Indeed, when a sale takes place on your website, you don’t just want to know from which source it came.

In fact, you also want to know which were the decisive clicks that enabled the Internet user to buy on your website: it’s not necessarily the same click!

Note that if you don’t set up a custom attribution model, the default model will only give you information on the last click.

And yet, it’s not necessarily the most important one, the one that was decisive in the purchasing process.

Let's talk about the different clicks for a better understanding:

The first click: as the name suggests, this is the first click that brings a visitor to your website. This could be a click on a sponsored ad, in natural results, from a Facebook page, from a link in a blog, etc.

Intermediate clicks: these are clicks made by the visitor to your site, after the first one, which were not decisive for a purchase. So, if the first click comes from a sponsored ad, the second click may well come from natural results, and the third from your e-commerce site’s Facebook page.

Let’s talk more about the last click.

As explained above, this is the default click used by Google Analytics.

Let’s take an example: a visitor arrives on your website from a sponsored ad.

He doesn’t buy anything, but comes back to the site the next day from the natural results by typing your company’s name into the search engine to buy the product he’s interested in and that he’d spotted the day before.

In Google Analytics, this sale will be attributed to the “Google/Organic” channel: true, but not in full!

Don’t forget the importance of first and intermediate clicks.

Ideally, in Google Analytics, you should be able to trace the various stages that lead to a conversion: they’re all important!

And that’s exactly what the personalized attractiveness template allows you to do.

We therefore advise you to assign a custom attribution model, preferably the one that best suits your e-commerce site.

In fact, there is no single model, but many. For example, you can define a model that attributes all your conversions to the first interaction with your website.

Towards ever-better use of data?

To fine-tune your marketing strategy, it’s essential to use data.

The most effective technique is still to use the tools available to you and exploit them to the full.

So it’s important to take the time not only to set up Google Ads and Google Analytics, but also to combine them.

In the end, you won’t necessarily get more data, but data that makes more sense.

And it’s precisely this meaningful information that will enable you to fine-tune your marketing strategy, improve your ROI and achieve your business objectives.

E-commerce sites: don’t neglect the analysis and personalization of Google Ads and Google Analytics data! These are invaluable tools for the long-term success of your business.

Reduce your infrastructure costs with auto-scaling

The cloud is everywhere, and we hear about it on every street corner. Chances are, you or your company use a cloud service in one way or another (AWS, Google Cloud, to name but two).

If you use it intensively (several machines running continuously), you may be interested in auto-scaling.

Auto-scaling allows you to add or remove machines as needed, in near-real time. For example, when user traffic increases dramatically and your servers are underwater, auto-scaling lets you add machines to free up the load on existing servers, reduce response times for your users and maintain the quality of service you offer.

Without auto-scaling, the opposite problem also exists: in off-peak periods, your machines have nothing to do, but you pay them anyway.

This is of course good for the Cloud platform you’re using, but not so good for you.

At Adenlab we use Google Cloud, and of course we use auto-scaling. The need is as follows: at night, we import data from your Google Ads, Analytics, Amazon, Bing, etc. accounts.

We learn from this data (machine learning), calculate new bids for your products, and update them on the relevant platforms. And we do so much more! All this every night.

Each of these operations has specific requirements in terms of volume and machine power. For example, we have some powerful machines for machine learning, and many less powerful machines for updating auctions.

Having so many full-time machines would be a net loss of budget, since most of them have nothing to do during the day. We therefore group these machines according to their type (power, etc.) into groups, called Auto-Scaling Groups.

Auto-Scaling Groups

Auto-scaling groups (ASGs) are used to group machines of the same type under the same auto-scaling policy.

By default in Google Compute Engine (GCE), you can choose to scale according to CPU or memory usage. Using the Stackdriver monitoring tool, you can create custom metrics to increase or decrease the number of machines.

Unfortunately, it’s impossible to automatically scale an ASG to zero, i.e. to cut all the machines in the group. This is quite logical, since in the absence of a machine we would no longer receive any metrics (CPU or other) leading to re-scale again.

In our case, many of our machines work at specific times of the day, usually for 8 to 10 hours at a time, and will have nothing to do for the rest of the day. Here’s an example of how our auto-scaling policy works:

We have a machine that does nothing for almost 2/3 of the day.

Auto-scaler to machine zero

Of course, we’d like to avoid having to pay for a useless machine. We’ll see that there’s a way to have zero machines and still have an automatic scaling system.

However, there is one prerequisite: we need a way of knowing when it’s time to scale up again.

At Adenlab we use a taskqueue(MRQ) for our recurring jobs. MRQ allows us to route our jobs to specific worker groups, depending on the queue and/or the task itself. Each worker group is linked to an ASG, so we have a clear metric here: for a given ASG, do we have any jobs queued?

With all this, we can use the following ASG structure:

A small (read: inexpensive) machine that will always be up (not self-leveling)

One or more ASGs, without auto-scaling policy

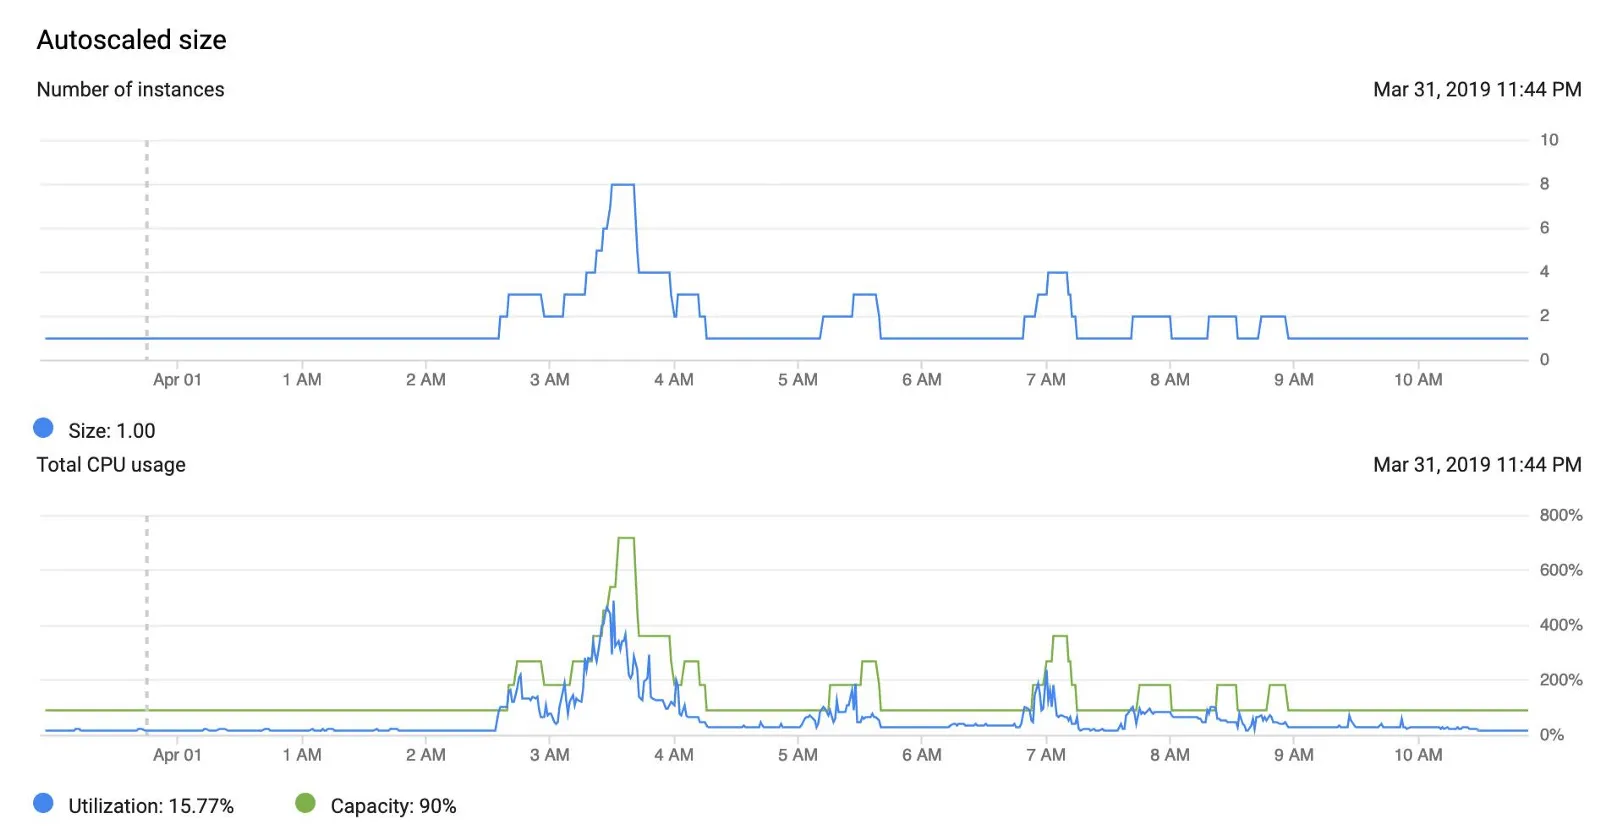
By creating an ASG without an auto-scaling policy, GCE will let us scale to zero machines if we want. On our little machine, we’ll have a script that runs every 5 minutes and checks each MRQ worker group for jobs to process.

If this is the case, the script will create an auto-scaling policy for the worker group concerned, and scale it up to 1 machine. The auto-scaler can then add additional machines as required, depending on the base metric configured (in our case, CPU utilization).

Let’s write an MRQ task for this script. Already the necessary imports :

from mrq.task import Task
from google.oauth2 import service_account
from googleapiclient import discovery
import time
import re

First, we need to configure a few parameters concerning GCP :

class ScaleUp(Task):
    project_name = "name of your GCP project"
    zone = "europe-west1-c" # adapt your zone here
    service_account_path = "service_account_credentials.json"
    # groups that are not concerned by this task
    groups_to_skip = ("group1",)

Add to groups_to_skip the worker groups that should not be auto-scalated: at least add the group of the machine that will unstack this task.

Now let’s write the main method of our task:

def run(self, params):
    credentials = service_account.Credentials               
        .from_service_account_file(
            self.service_account_path
        )
     
    self.service = discovery.build(
        "compute", 
        "v1", 
        credentials=credentials, 
        cache_discovery=False
    )
    # We need to have a way to know what we want our different
    # autoscaling policies to be.
    # We could store them in a DB and fetch them here,
    # so that it is shared with our Ansible playbooks for instance.
    # For simplicity here we'll just hardcode them here:
    self.autoscaler_configs = {
        "group2": {
            "min_replicas": 1,
            "max_replicas": 10,
            "cooldown": 180,
            "cpu_target": 0.80
        },
        "group3": {
            "min_replicas": 1,
            "max_replicas": 8,
            "cooldown": 180,
            "cpu_target": 0.90
        }
    }
    # First we need to fetch existing ASGs
    self.fetch_groups()
    # Next we want to know which groups currently have an autoscaler
    self.fetch_autoscalers()
    # Check each groups and see if we should scale them up
    self.check_groups()

Here’s how to retrieve ASG information:

def fetch_groups(self):
    self.groups = {}
    request = self.service.instanceGroupManagers() 
                          .list(
                            project=self.project,
                            zone=self.zone
                          )
    while request is not None:
       response = request.execute()
       for asg in response['items']:
           group_name = asg["baseInstanceName"]
           self.groups[group_name] = {
                "base_name": group_name,
                "name": asg["name"],
                "size": asg["targetSize"],
                "link": asg["selfLink"]
            }
       request = self.service.instanceGroupManagers() 
                             .list_next(
                               previous_request=request,
                               previous_response=response
                             )

We hydrate self.groups with ASG information. For more info on ASG structure, see here.

Now let’s take a look at the code we’ll use to create an autoscaler for a given worker group:

def create_autoscaler(self, group):
    autoscaler_config = self.autoscaler_configs[group]
    config = {
        "target": self.groups[group]["link"],
        "name": "%s-as" % group,
        "autoscalingPolicy": {
            "minNumReplicas": autoscaler_config["min_replicas"],
            "maxNumReplicas": autoscaler_config["max_replicas"],
            "coolDownPeriodSec": autoscaler_config["cooldown"],
            "cpuUtilization": {
               "utilizationTarget": autoscaler_config["cpu_target"]
            }
        }
    }
    operation = self.service.autoscalers().insert(
        project=self.project,
        zone=self.zone,
        body=config
    )
    wait_for_operation(operation)

You can find the wait_for_operation code in this example.

The last thing we need is a method for scaling up an ASG:

def scale_up(self, group, size=1):
    if self.groups[group]["size"] > 0:
        # Already scaled up
        return
    # Make sure we have an autoscaler
    if not self.autoscalers.get(group):
       self.create_autoscaler(group)
    operation = self.service.instanceGroupManagers().resize(
        project=self.project,
        zone=self.zone,
        instanceGroupManager=self.groups[group]["name"],
        size=size
    )
    wait_for_operation(operation)

The final logic of our task is quite simple:

def check_groups(self):
    # Now we have everything we need for the actual task logic:
    for group in self.groups:
    if group in self.groups_to_skip:
        continue
    if self.should_scale_up(group):
        self.scale_up(group)

should_scale_down is the method that should contain your scaling logic. We don’t provide it here, but remember that in our case it’s a question of checking whether or not we have jobs waiting to be processed.

This task is scheduled to run every 5 minutes. This is convenient for our use case, because even if there are no pending jobs, a team member can perform an action at any time, which will result in the creation of a new job.

We don’t want to have to wait too long for it to be started. Of course, for any user actions that create jobs and are supposed to get a quick response, we need a dedicated machine that’s always up.

In most cases, however, it’s best to avoid asynchronous tasks for user interactions that require feedback.

So now we can scale up a machine when we need it, and GCE will take over if we need more. But we also need a way to scale down to zero when we don’t need it again!

To do this, we have a second task, running every 30 minutes, which will execute the same code as the first, with the difference that it will remove the autoscaler and scale to 0 machines if there are no pending jobs.

We can inherit our new task from the previous one, so that we have all the methods we need to communicate with GCP :

class ScaleDown(ScaleUp):

We also need some new methods to scale down:

def delete_autoscaler(self, group):
    autoscaler = self.autoscalers[group]
    operation = self.service.autoscalers().delete(
        project=self.project,
        zone=self.zone,
        autoscaler=autoscaler["name"]
    )
    wait_for_operation(operation)
    
def scale_down(self, group):
    if self.groups[group]["size"] == 0:
        # Already scaled down
        return
    # Delete the autoscaler so that we can scale to zero machine
    if self.autoscalers.get(group):
      self.delete_autoscaler(group)
    operation = self.service.instanceGroupManagers().resize(
        project=self.project,
        zone=self.zone,
        instanceGroupManager=self.groups[group]["name"],
        size=0
    )
    wait_for_operation(operation)
    
def check_groups(self):
 
    for group in self.groups:
        if group in self.groups_to_skip:
            continue
        if self.should_scale_down(group):
            self.scale_down(group)

When we know there are no more pending jobs, we remove the autoscaler and scale down completely. Again, should_scale_down contains the scale down logic to be implemented.

The positive side of this approach is that we can have several scaling criteria. For example, to avoid scaling up and down several times in a row too close together, we can also check that a certain amount of time has elapsed without a job being created before scaling down.

Conclusion

We have seen that by deleting the autoscaling policy, we can delete all the machines in an instance group.

We’ve written an autoscaling task that uses custom logic to determine whether a group should be up (1 machine) or down (0 machine).

The disadvantage is that we have to have a separate machine, always up and ready to unpack our autoscaling task.

The 7 attribution models in Google Analytics

The secrets of Google Analytics: the different attribution models and their functions

Discover what an attribution model is and the secrets to choosing the right one for your E-Commerce business. “Analytics Secrets” is a series of articles giving you our advice on optimizing your Analytics account and analyzing your website data.

What is an attribution model?

An attribution model is a model that distributes the relative influence of each traffic source for a given objective. In e-commerce, it determines which traffic sources have led to a sale. Using a relevant attribution model allows you to optimize your Google Ads strategy.

We also recommend that you read our study on Attribution of e-commerce sales by acquisition channel.

The 7 main attribution models.

All traffic sources together account for 100% of attribution points. Depending on the attribution model used, this 100% is allocated differently:
Last interaction: the last source of incoming traffic gets 100% of the credit.

⇒ First interactionThis is the 1st point of contact which obtains 100% of the points.

⇒ Last non-direct clickWhen direct attribution channels are removed from the equation, all points are awarded to the last indirect click.

⇒ Last click on a Google Adss: 100% of points are awarded to the last ad clicked on Google.

⇒ Linear allocationEach channel used by the visitor up to the point of sale shares the 100% equally.

⇒ Depreciation over timeAll traffic sources are taken into account, but the last ones score more points.

⇒ Position-based allocation1st and last contact points are awarded 40% of points each. The others share the remaining 20%.

⇒ Data-driven attribution: This attribution model uses Google Ads algorithms and actual performance data from your campaigns to determine how clicks on your ads contribute to conversions. Unlike other models, it’s dynamic and customized according to your account data.

How do you choose your attribution model?

The choice of attribution model depends on each company’s conversion tunnel.
Knowing your visitors’ behavior (sources of traffic, average time to conversion, etc.) enables you to decide which attribution model makes the most sense for your company.

In fact, it’s also necessary to set up more features in your account, such as the Google Analytics Conversion Funnel. Find out more in our article “How to set up conversion funnels in Google Analytics“.

Audience: the importance of Google Analytics

Measuring your audience is an essential step in developing your business on the web.

It enables you to take stock of your acquisition strategies and the quality of your traffic. Google Analytics is a powerful tool for accessing quality information.

See also: Boosting your SEA campaigns with Audiences and Remarketing

Google Analytics: an indispensable tool for your company's success

To ensure the success of your e-commerce or lead generation site, you need to make data analysis a priority.

You need to understand consumers’ needs, where they are, their gender and age, and anything else that might help you improve their experience on your site.

The more information you have about them, the more you’ll be able to personalize your approach, identify problems and improve your communication.

The number of people affected

You can find out how many people are affected each day.

This measurement enables you to understand whether your advertising actions are having an impact, and whether you’re continuing to increase your audience and traffic.

Which acquisition channels

Internet users can arrive on your site through various channels: social networks, search engines, partner sites, etc.

The acquisition report identifies how your prospects arrived on your site. This may be through your advertisements, or your Facebook page…

Once you know where visitors are coming from, it’s vital to identify the channels that bring you the most conversions, so you can intelligently allocate your investments to the right channels.

See also: Audience exclusion, or how not to wear out your prospects?

Where do you lose your prospects' attention?

Using Google Analytics to measure your audience enables you to perfect your communication tools.

In fact, through analytics data, you’ll know where your audience leaves your site, and identify the pages where they leave.

To keep prospects on your pages longer, we recommend A/B testing. This practice gives you the opportunity to imagine two strategies and evaluate their impact.

You can choose between two approaches, and only keep the one that really works.

Measure your audience to know it perfectly

This free tool gives you access to various indications:

Most visited pages
The social network where you have the most impact
Usage habits: smartphones, computer, tablet

Conversion rate

The main objective of your e-commerce business is to generate sales and find customers.

Google Analytics gives you a helping hand by telling you which channels have helped you sell and convert. So you need to ask yourself the right questions:

Are your social networks powerful? Do your advertising campaigns convert? Have you seen a return on investment?

Google Analytics, made available to you free of charge by Google, should become your best ally in developing your e-commerce business.

To take your analysis a step further, we strongly recommend you read our article on setting up the Google Anlaytics conversion funnel.

This step-by-step guide will enable you to configure different funnels in your Google Analytics account.

Google Analytics: Key configuration steps


Configuring Google Analytics, a key step!

Google Analytics provides a wealth of information about your online presence. There’s just one condition: set up your analytics account properly beforehand.

Who wants to make decisions based on incomplete or inaccurate data? In this article, we take a step-by-step look at how to set up Google Analytics correctly.

Let’s start with the mistakes regularly made when setting up Google Analytics. Even if your business is unique for many reasons, you can start by following these tips, which apply to all sites, even yours 🙂

Also read: How to set up the Conversion Funnel in Google Analytics

1. Check that the tracking code is correct and complete

The tracking system is at the very top of the list of configurations that need to be set up correctly. Without it, you run the risk of missing out on key data on existing conversion stages on your site.

Tools for checking your configuration

There are various tools you can use to check your analytics configuration and make sure everything’s running smoothly.

Tag Assistant: perfect for checking configuration and resolving detailed problems at “page” level.

Tag Assistant is a Chrome extension that can be used to validate and diagnose your Google Analytics data on a page-by-page basis. Once you’ve solved a problem, you can return to Tag Assistant to check that your tags are working properly.

Screaming Frog SEO Spider: ideal for detecting site bugs across all pages. This tool is perfect for finding out whether your tracking code is correctly installed on all your pages.

There are two versions available: a FREE version, for websites up to 500 URLs, and a paid version, for more than 500 URLs.

Your tracking code
At the very least, you should check two things with regard to the tracking code installed

Tracking code version: if you haven’t already done so,
make sure you switch to Universal Analytics. Tag Assistant will display the
version you’re using and whether or not you need to migrate.

**Code location **: where to place your tracking code depends on whether you use Google Tag Manager or not.

It is increasingly recommended to use Google Tag Manager for tracking configuration.

Getting the code implementation right (according to your tagging plan) is a crucial step in getting reliable information from Google Analytics.

2. Setting objectives

Setting up Google Analytics objectives is a crucial step in data analysis. Without these objectives, you won’t be able to find out why your site is working or not, and where you can improve.

Objectives are generally based on form validations, downloads or purchase completion.

If your site is primarily dedicated to lead generation, it’s important to set your objectives on the form validation pages.

For e-commerce, conversions are essentially measured by the validation of a product sale. Tracking is specific to e-commerce.

It is obtained by integrating a few extra lines of code into your site.

In the article“How to set up your conversion funnel in Google Analytics“, we explain step-by-step how to create your own goals and conversion funnel in your Google Analytics account.

3. The backup "view

By default, Google Analytics lets you configure up to 100 accounts, 50 properties per account and 25 “views” per property. Multiple views are strongly recommended.

You should always configure a raw data view. Read this article if you’d like to know more about configuring different views in Google Analytics.

No matter how experienced you are, you need to have a backup view in place. Very often, there are several people working on the same Google Analytics account.

Make sure that NOBODY modifies the raw data view.

Captivate your audience: how do you find the right themes for your social content?

How do you captivate your customers and prospects? How to attract their attention on social networks? How to make them want to click on your content and interact with your online store.

See also: Google Ads or Facebook Ads campaigns: How to ensure success with targeting, remarketing and audiences

How to grab your audience's attention

To attract your target’s attention, it’s important to know their tastes and interests.

To get your audience to visit your e-commerce site, you need to add value. You have to teach them new things and keep them informed.

Demonstrate your expertise and become an indispensable source of information.

Create a link to get closer to your audience

Do you want to communicate with your target audience, but don’t know what to say? What content might interest them?

The first step is to put yourself in their shoes. What questions might your customers have about your products or services?
If they’re interested in what you’re selling, it’s because they like it or need it. That’s why it’s important to provide them with all the information they need.

Don’t just think about your sales and don’t be egocentric. It’s essential to look at the customer and put yourself in their shoes. If you were a customer of your company, what would you like to see? What questions do you have about your products?

To captivate your audience, the second step is to engage with them. Many companies don’t think about this, but you can do it on social networks like Facebook or Instagram.

Also send out questionnaires and surveys in your newsletter. But don’t make them too long. Keep it simple: “What content would you like to see?

These few tips will enable you to draw up an initial list of themes to address to arouse your target’s curiosity.

See also: Building your audience: foolproof techniques on Facebook

Analyze the analytics data in your possession

You would like to :

  • Evolve your e-commerce?
  • Capture prospects’ attention?
  • Tackle themes that appeal?

Often you’re not starting from scratch, but rather evolving your existing online offering and strategy. That’s why all the information you have is beneficial and worth using.

Your analytics data is a real gold mine. With the right analysis, you’ll know which pages are popular on your site, and how much time is spent on your content.

Thanks to this indication, you can identify the major themes and most-read articles, which will certainly need to be optimized or expanded.

Read comments on social networks. They can be a source of inspiration.

Join groups on Facebook and Linkedin. Consumers usually share life experiences and questions. You identify problems and present solutions to prospects.

Find inspiration through competitive intelligence

To face up to the competition, there’s nothing better than discovering the subjects they cover.

Which publications are successful? What solutions are presented? What situations give them visibility?

Your competitors have the same audience as you. So they can inspire you.

Conclusion

To captivate your audience, you can tackle any subject as long as it falls within your thematic area.

The main objective is to reach a portion of your prospects with content that informs them and can be useful, and thus build customer loyalty.

Stay in your niche so you don’t lose out on opportunities. Don’t be afraid to show your personality and be different.

Our SEA agency and Ecommerce experts are at your disposal to discuss the best strategies for your target audience.