Google Analytics is a powerful but complex tool. Discover the 5 mistakes you should avoid to optimize your analysis.
You can also download our Google Analytics study on the distribution of Ecommerce sales and how they are allocated according to acquisition channels here : Google Analytics Ecommerce Attribution
Analytics secrets: 5 mistakes to avoid with Analytics.
Analytics, as its name suggests, is based on data analysis.
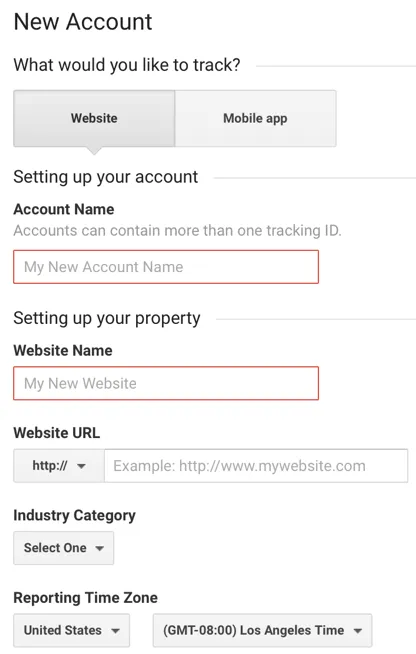
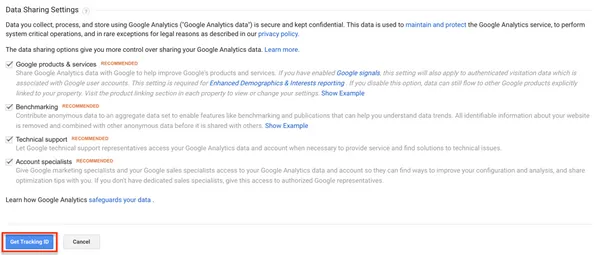
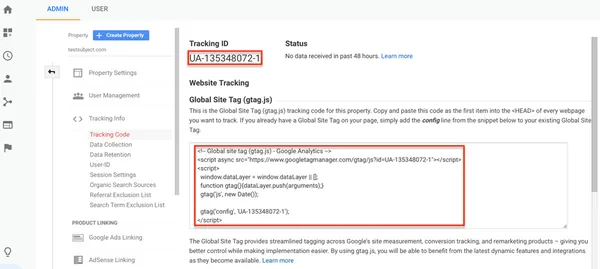
It’s essential that your account is set up properly.
Used by a machine learning solution, data enables you to optimize your bidding strategy simply and easily.
Conversely, inaccurate data will distort your results.
Here are 5 mistakes to avoid with Analytics.
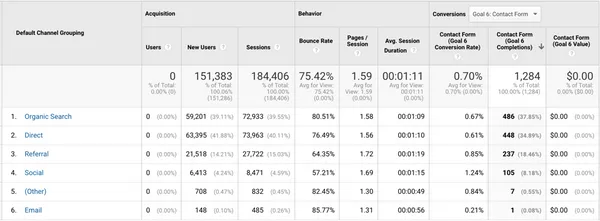
1. Your payment platform is counted as a referral site.
When it’s time to pay, your customers are directed to Paypal, Shopify, Payoneer (or other) before being redirected to your site.
Analytics counts this as a new session and your payment platform appears as a referral.
The solution? Add your payment solution to the list of sites to be excluded from your referrals.
Although ROAS and ROI (Return on Investment) are often used interchangeably, they differ.
ROI takes into account overall costs, while ROAS focuses solely on advertising investments. ROAS is therefore better suited to evaluating the effectiveness of Google Ads campaigns.
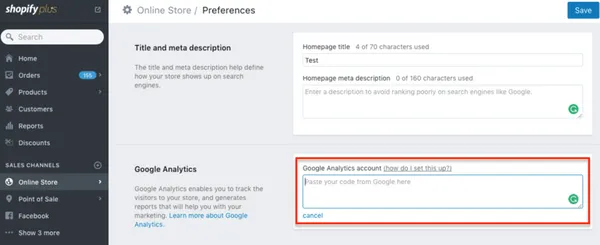
2. Your tracking code is partially installed on your site.
If your visitor navigates between listed pages (your pages that convert) and unlisted pages, his or her journey is broken down into several smaller sessions, resulting in erroneous results.
Use GA Checker to check that your tracking code has been installed throughout your site.
3. Your company's IP address is not filtered.
Who visits your site most often? You do! These sessions should be excluded, as they are not representative of your customers’ behavior.
All you need to do is filter the IP addresses of your company, your service providers and your employees, if they work from home.
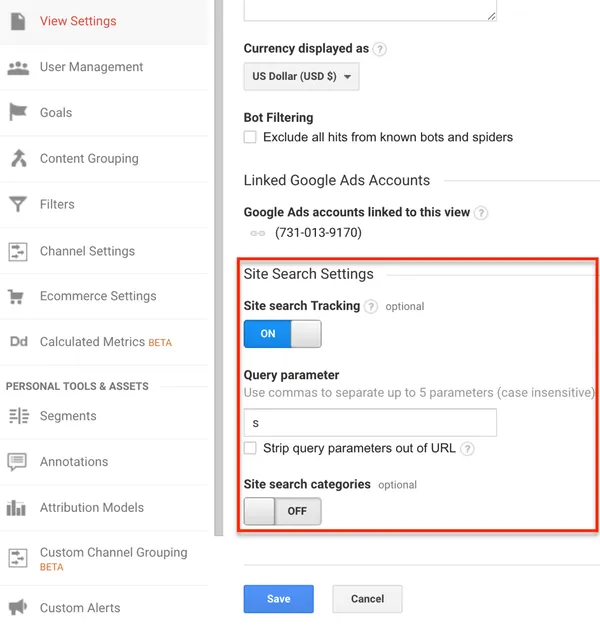
4. Robots are not excluded.
Robots – whether acting on behalf of search engines or malicious entities – regularly scan your site.
If their sessions are counted, they report high bounce rates and very short visit times.
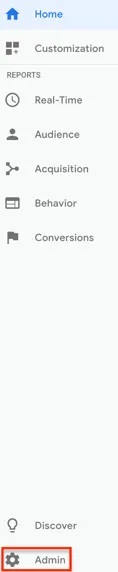
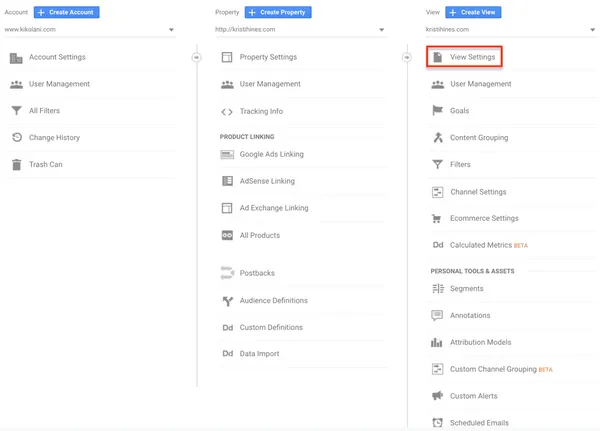
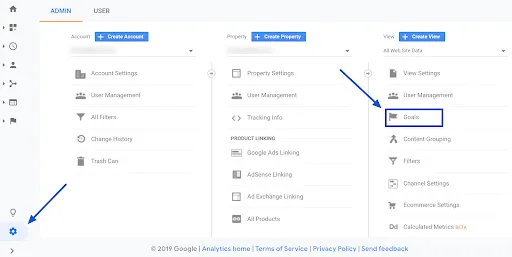
Check that the “Robot filtering” option is enabled in your Analytics account (Administration > View, View settings).
5. Important events are not documented.
Promotion, launch, redesign of a page’s UX, etc. are all important events to take into account in your follow-up.
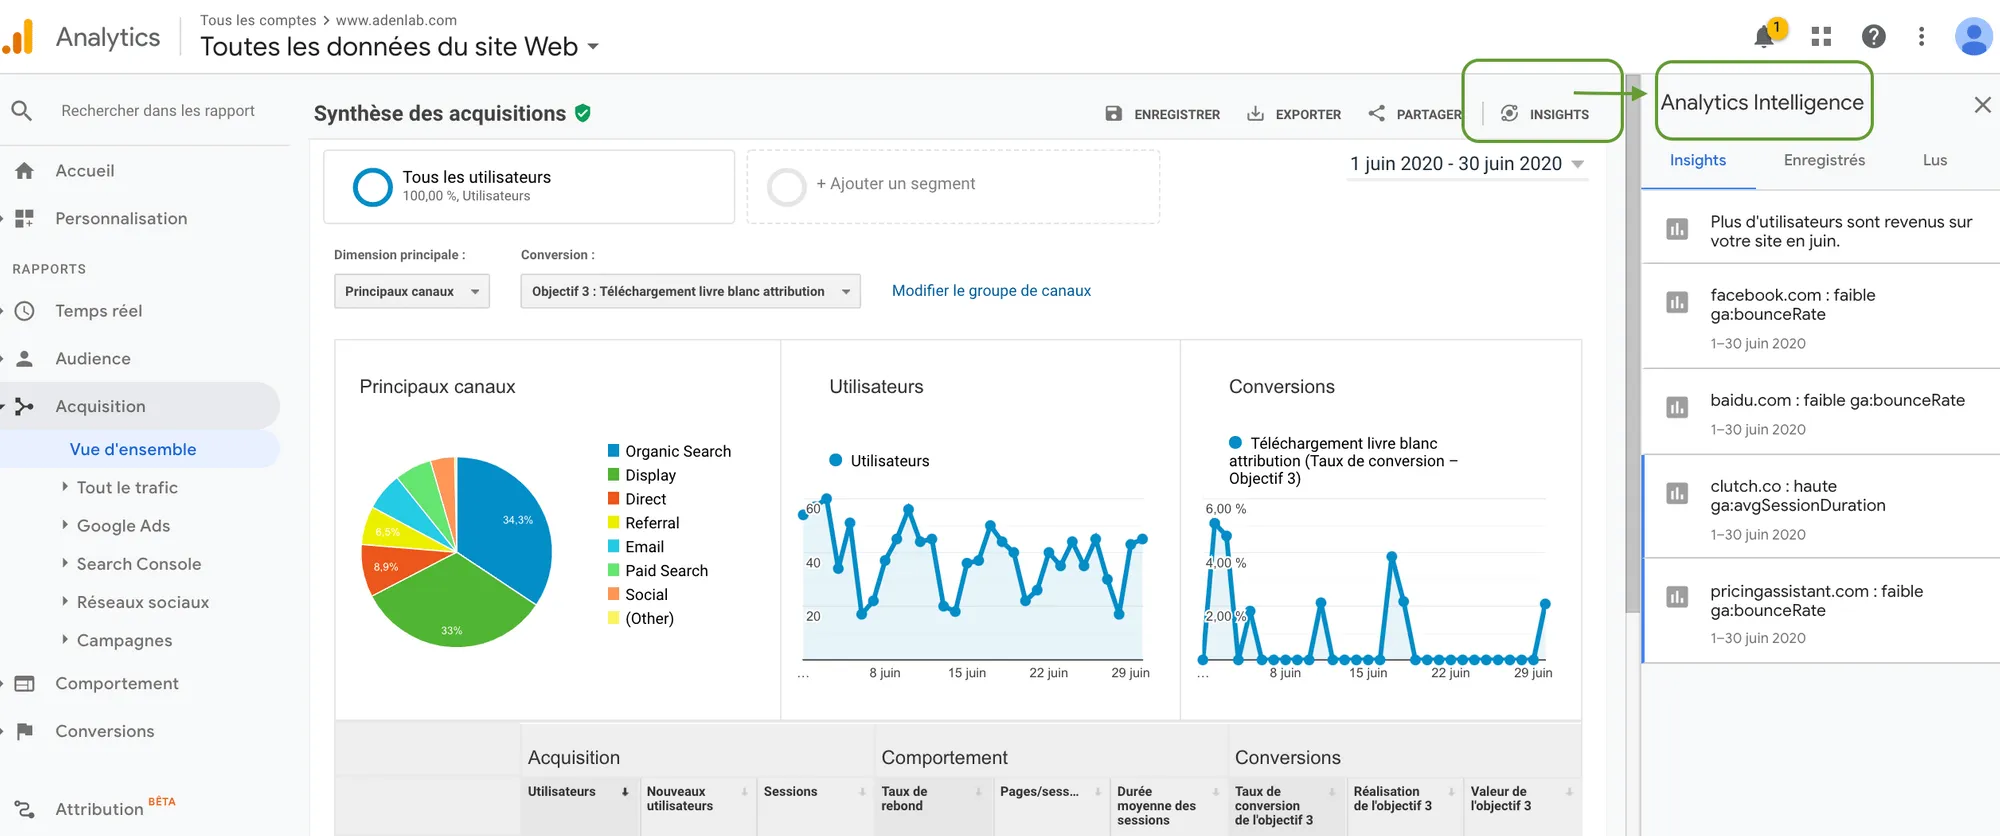
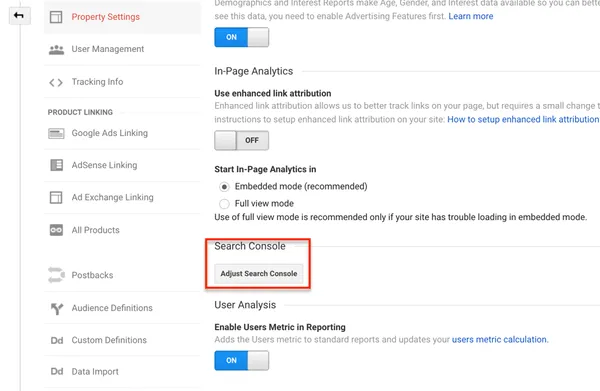
The annotations available in Analytics enable you to measure the impact of these actions on your results. Would you like confirmation that your Analytics data is not distorted?
We carry out an audit of your account before the start of each campaign to check the quality of your data.
Have you ever thought of using a Machine Learning solution to improve your performance? Contact us to find out more!
CONCLUSION
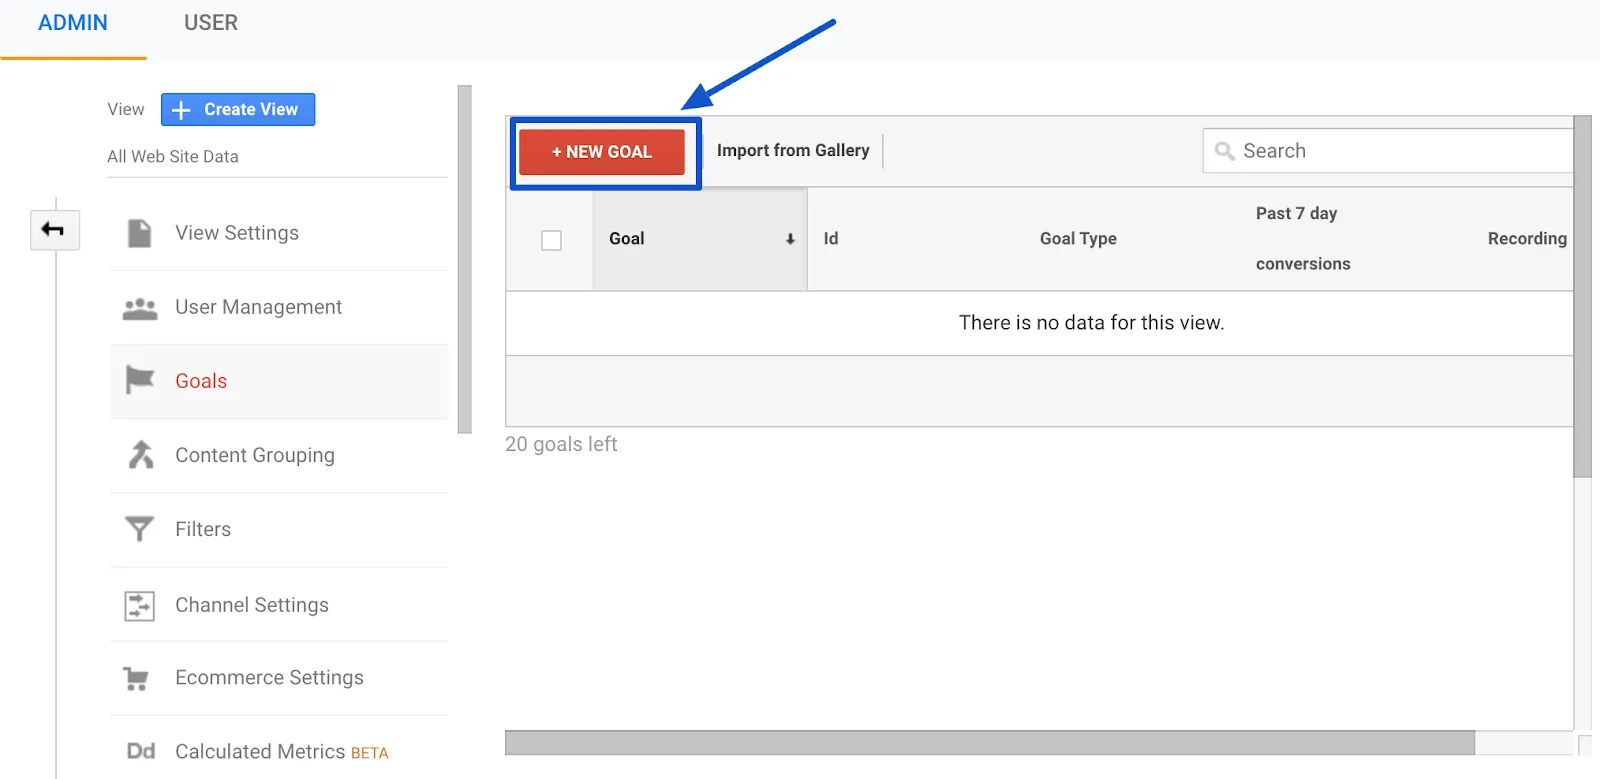
If you need help with your tagging plan oroptimizing your Analytics accounts, contact us, we’ll be delighted to discuss and implement the solutions you need;
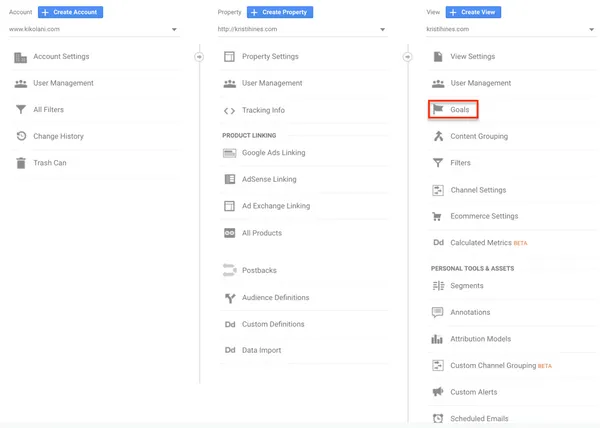
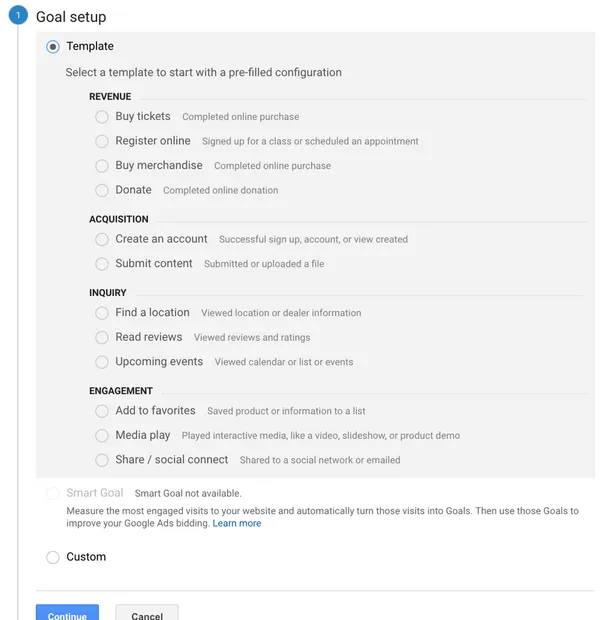
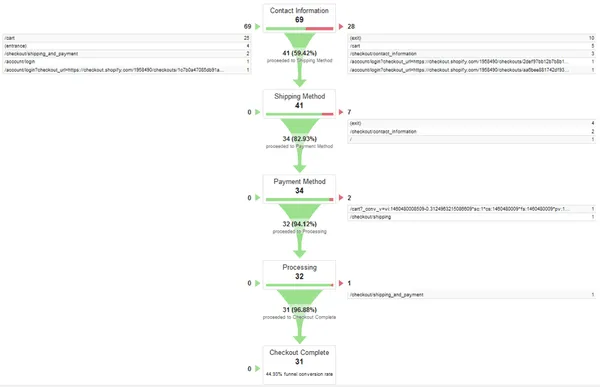
Also, if you want to advance on your own and become an Analytics ninja, don’t forget to work on your Conversion Funnels; Check out our artilce “How to set up Conversion Funnels in Google Analytics“: you’ll be guided step by step; Happy reading!


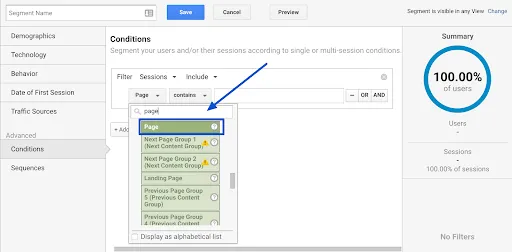
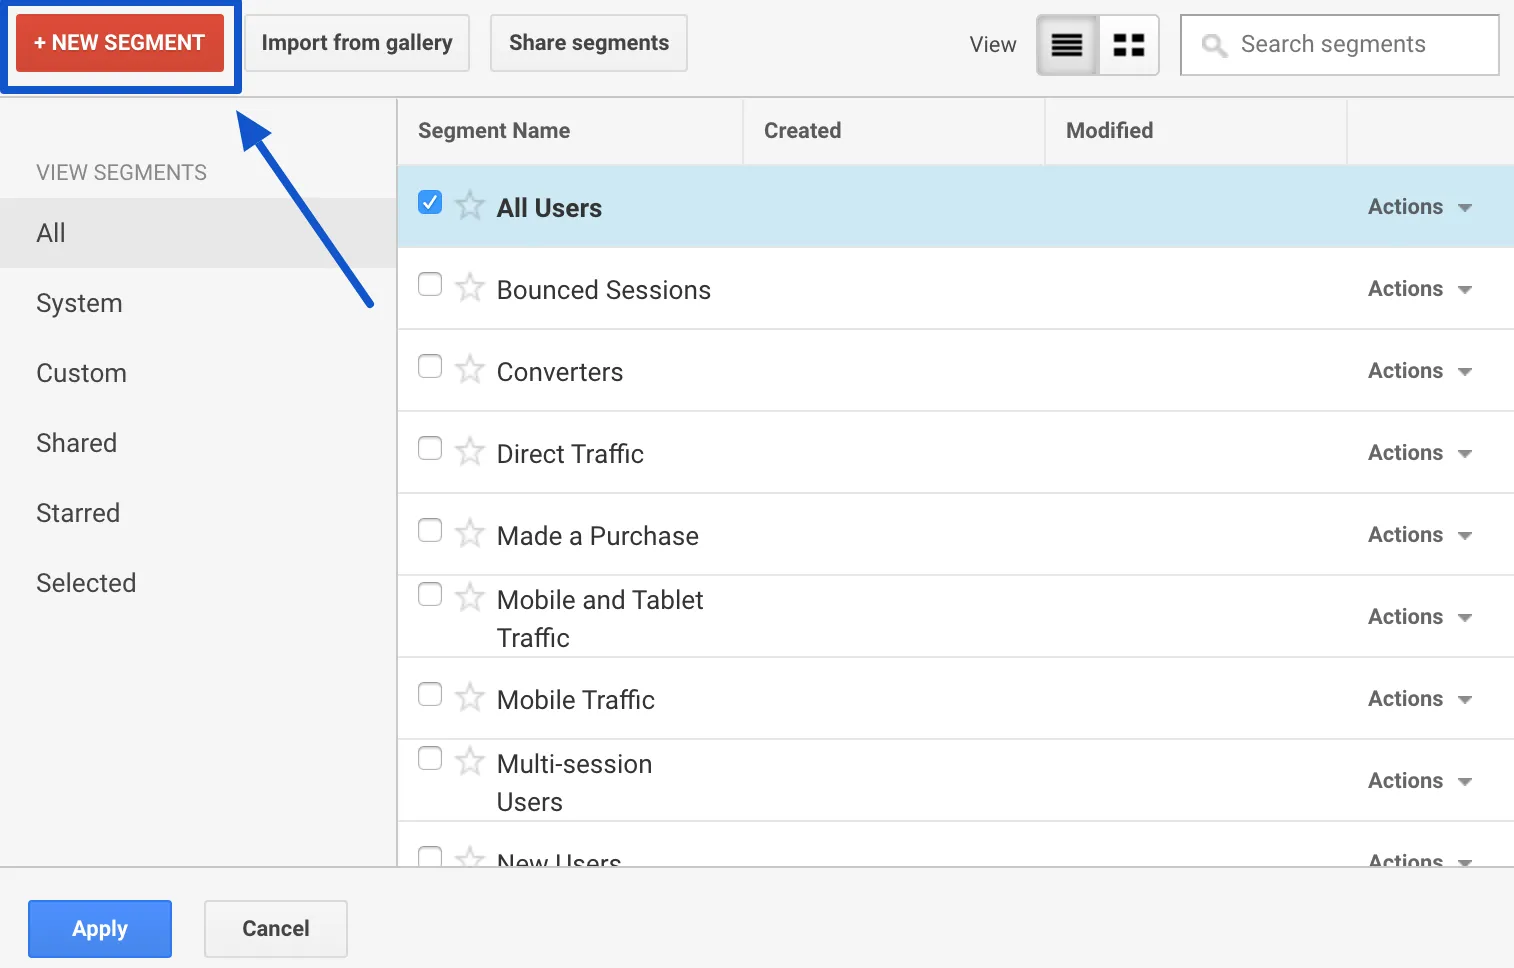 Then click on “Conditions in the “Advanced” menu on the left.
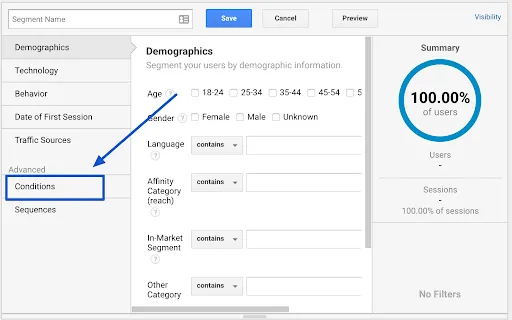
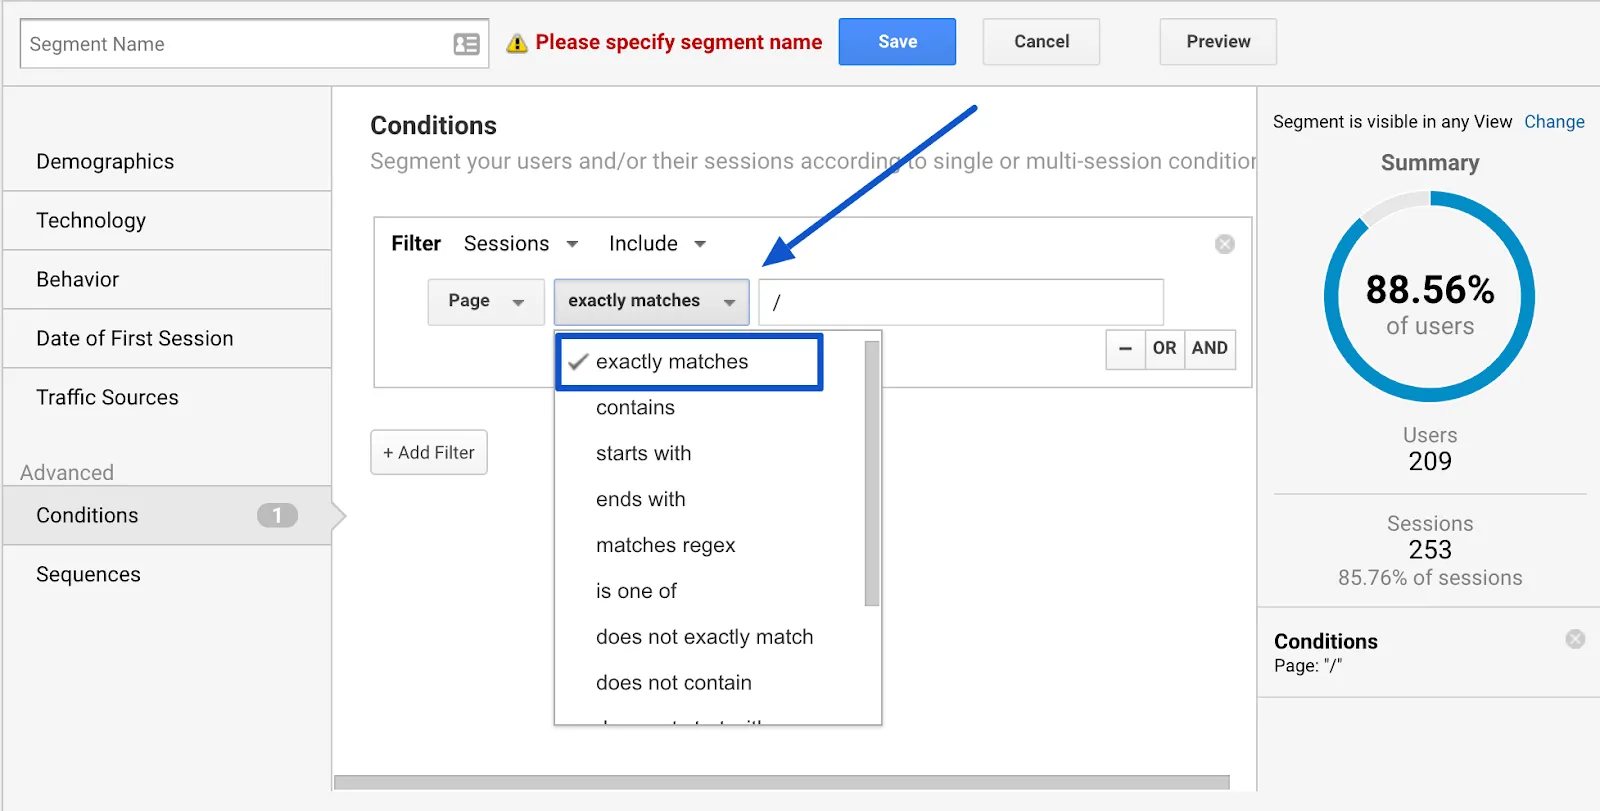
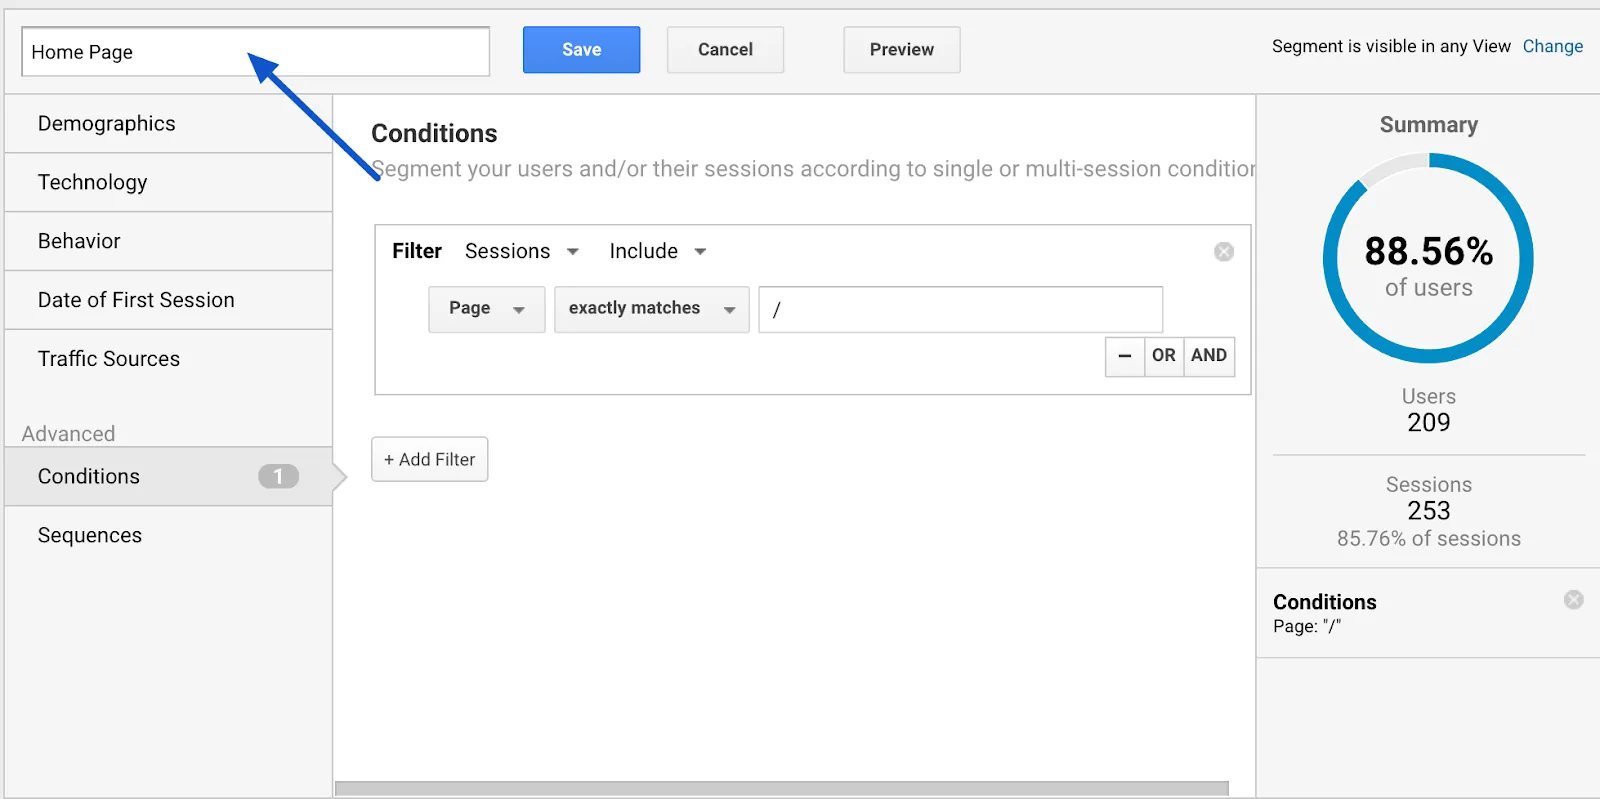 Name your segment explicitly: here, “Home Page”.
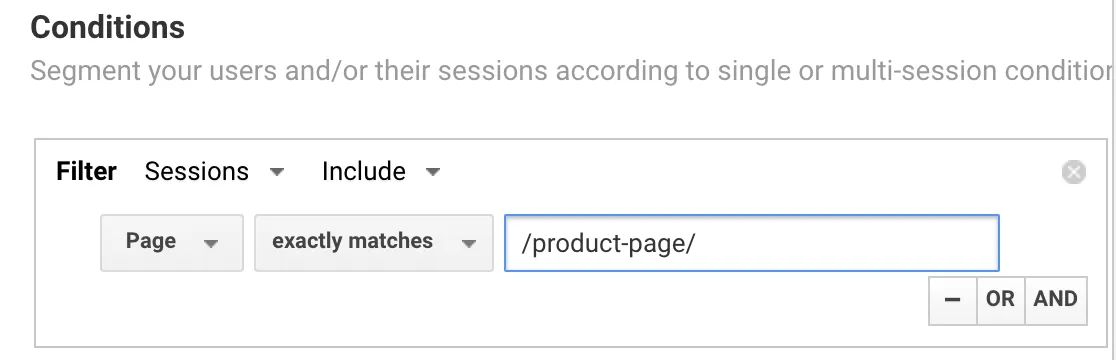
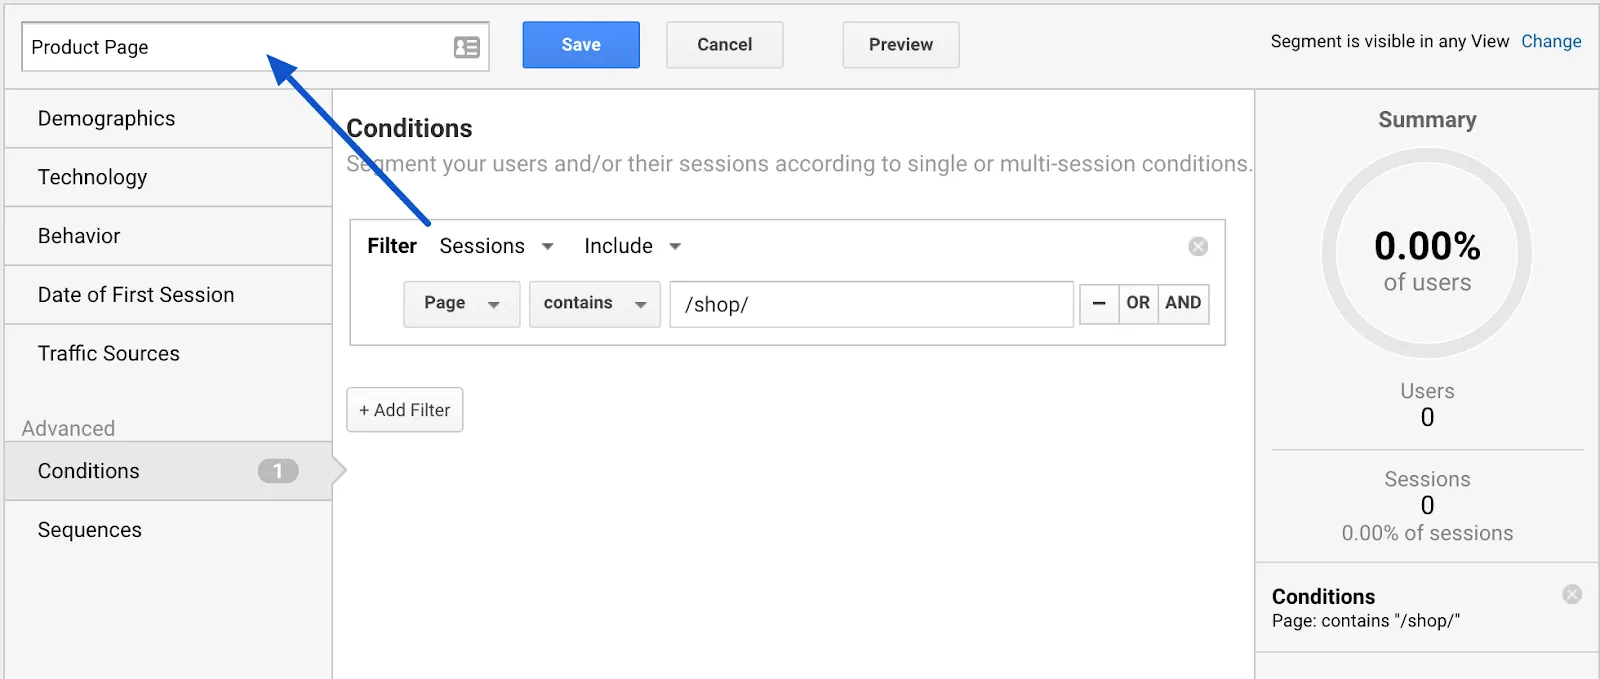 Save the segment as “Product Page” and save.
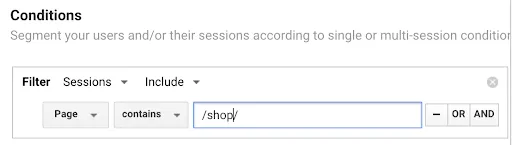
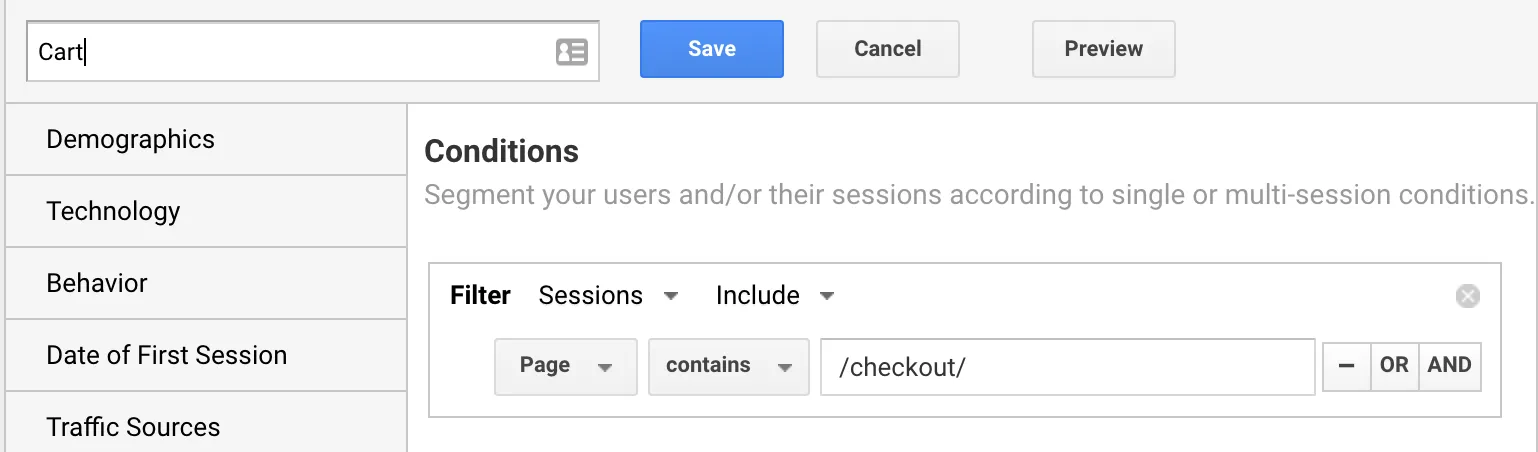 Shopping Cart” page segment
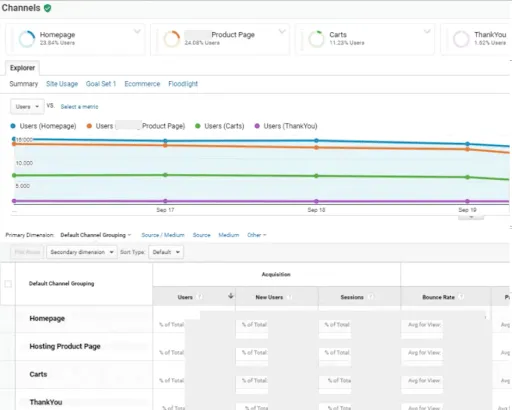
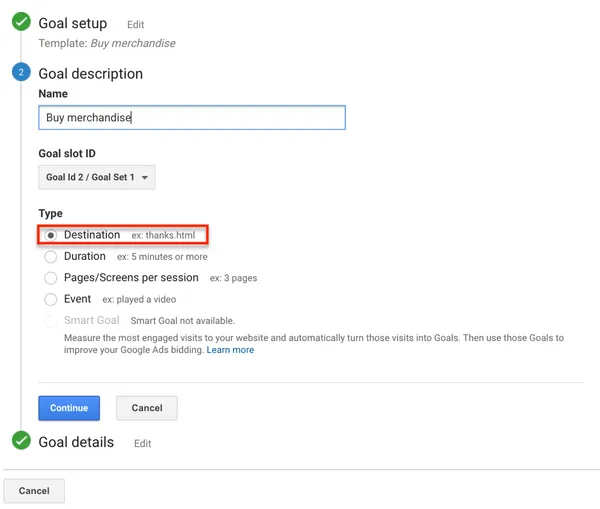
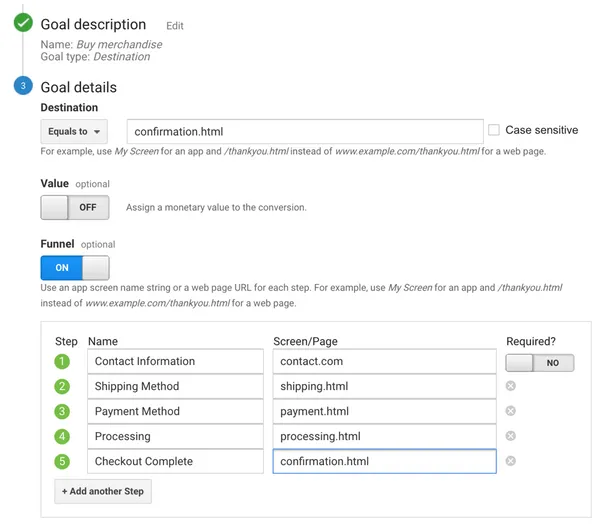
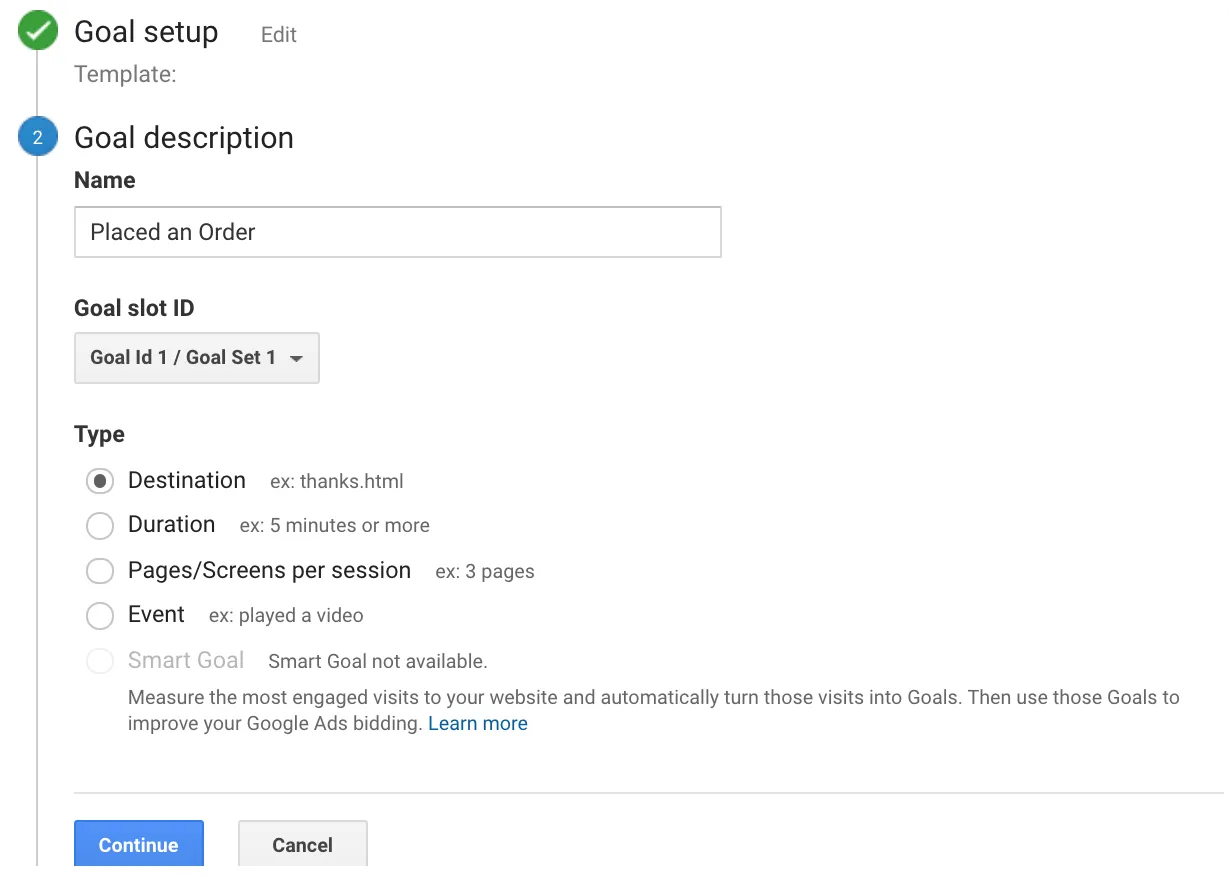 In the last screen, we’ll use our thank-you page as the URL and select “Equals from the drop-down menu:
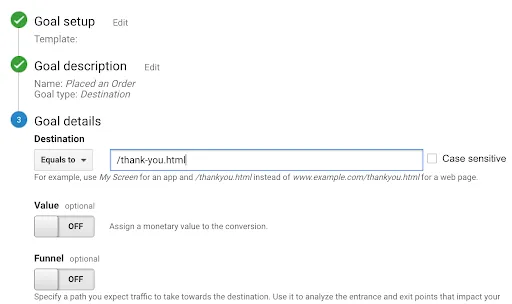 You now have the option of defining a value for each conversion. If you use your website primarily for lead generation, your revenue is probably not captured by Google Analytics. You can still estimate it by setting the Value field to ON, then specifying an amount. For example, if you’re using this goal to track white paper downloads, you can assume that, on average, each download is worth $100 to your business, so you should enter that. Again, this field is optional.
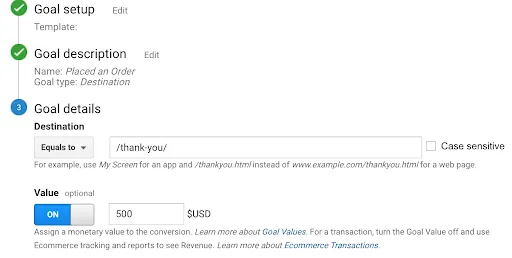
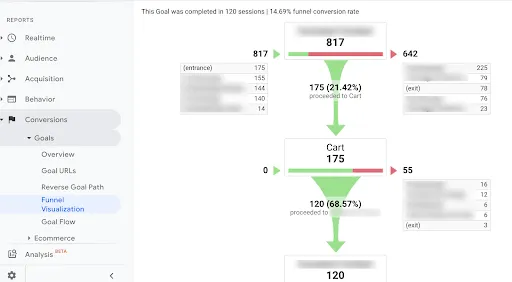
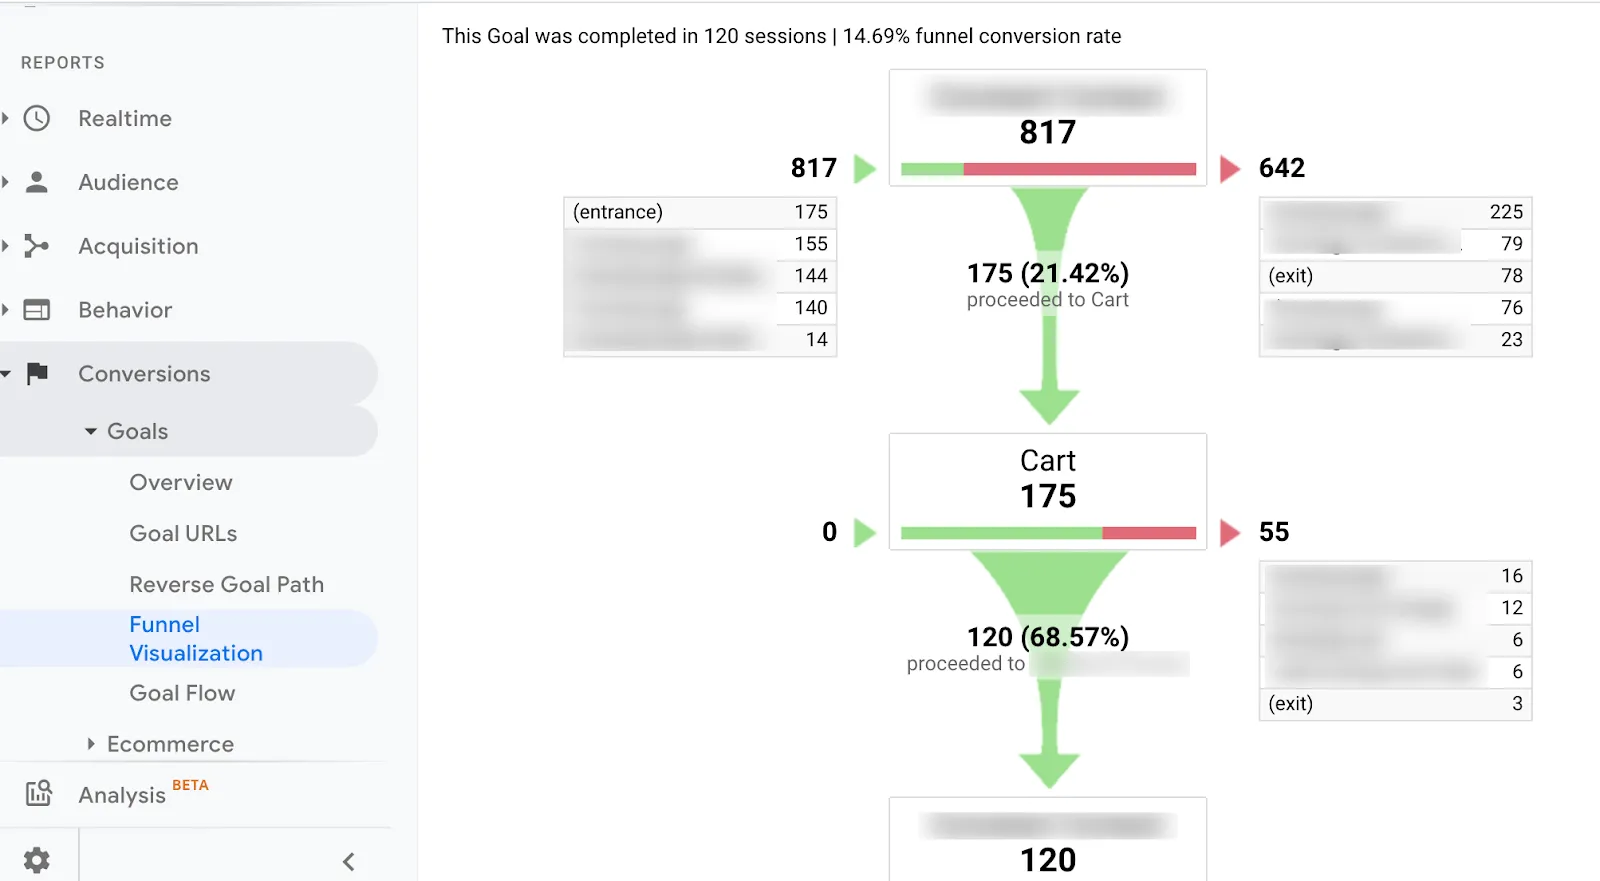
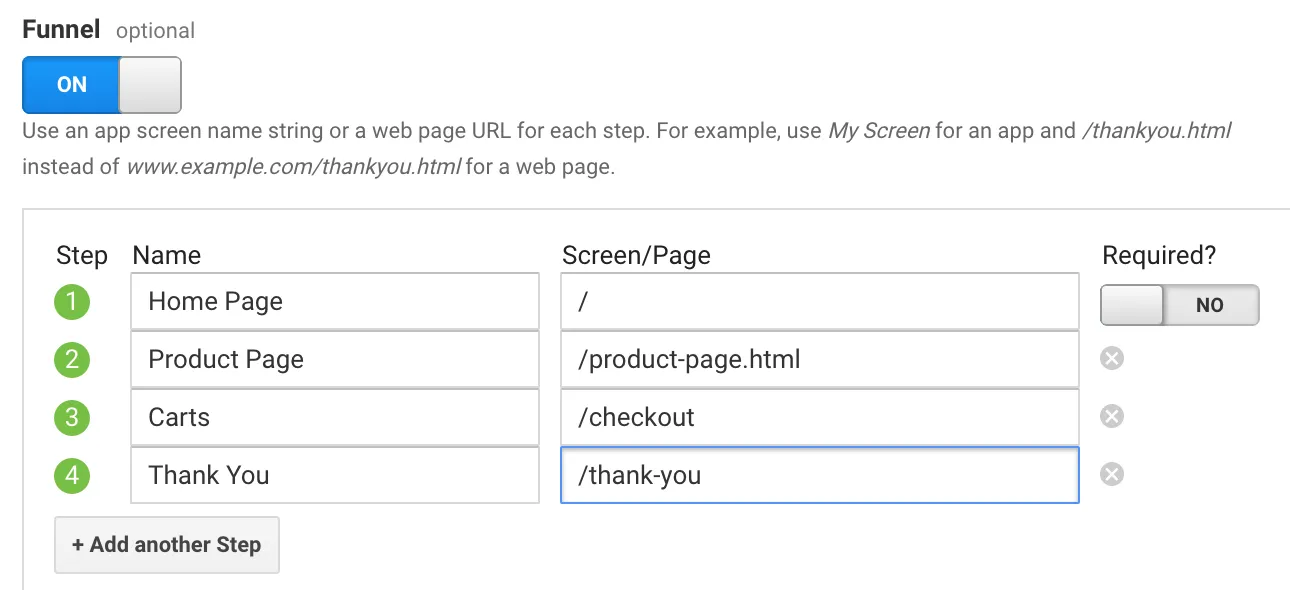 Finally, click on “Check this goal” to verify your work. Next, return to Conversions > Goals and you’ll see that you can now view the Funnel Visualization report where it shows you a visual representation of your funnel: