Long-term metrics such as customer lifetime value (LTV) and churn are often overlooked in analysis and optimization processes. Certainly because it’s quite difficult to track and measure loyalty using common tools like Google Analytics and Optimize. However, they can be very instructive when combined with other, more basic metrics, such as transactions or revenue. In this article, we take a look at several ways of tracking churn and customer lifecycle with Google Analytics, and suggest some even more useful solutions…
Depending on the software you use, there may be ready-made solutions. For example, on Shopify, you can use Littledata to send a more accurate LTV value in a customized Google Analytics interface. More often than not, however, there’s no good solution available and it’s necessary to make new developments on your existing configurations in your Analytics accounts. Some people often mistakenly believe that these long-term retention metrics are only relevant to a few specific types of business. It’s true that metrics such as churn rate are essential for SaaS and subscription products, yet any company that closely monitors its business should have its long-term performance metrics in place, such as loyalty rate, re-purchase rate. And we’re not just talking about tracking them, we’re talking about analyzing them and optimizing the business based on them. And we’re not the only ones! Visit Harvard Business Review points out: “Acquiring a new customer is five to 25 times more expensive than retaining an existing one. It makes sense: you don’t need to devote time and resources to finding a new customer – you need to keep the one you already have.” So, if you’ve been focusing on new customer acquisition and metrics like revenue or transactions, this is the article for you!
How do you measure loyalty indicators such as LTV and churn?
Current customer loyalty measures(Source )
- Churn rate
- Sales attrition rate
- Growth rate of existing customers
- Repeat purchase rate
- Product return rate
- Days sales outstanding
- Net promoter score
- Time between purchases
- Rate of loyal customers
- Customer lifecycle value
User identification for Google Analytics
This means you need to identify the user over time, even if they use multiple devices or browsers. Fortunately, in most cases, actions such as making a purchase or subscribing to a membership involve some form of authentication. While it’s possible to track retention metrics with Google Analytics alone, in most cases you’ll get much better (and more accurate) results by combining it with other solutions.
Sending retention data to Google Analytics
The exact workflow depends on the software (CRM, CMS, database, etc.) you use, but the general process looks like this. Create a custom dimension in Google Analytics (tailored to the user)
1. Create a custom dimension in Google Analytics (tailored to the user)
2. For logged-in/identified users, extract relevant retention metrics from a database or other system (CRM, CMS...)
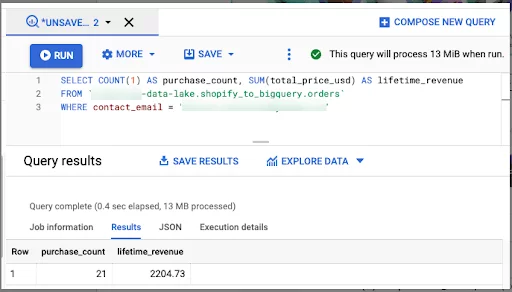
Here’s an example with order data stored in BigQuery.
3. Make retention measurements available in the data layer (Datalayers)
4. Upload your retention metrics to the dashboard
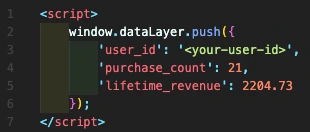
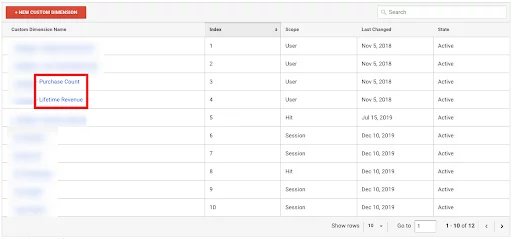
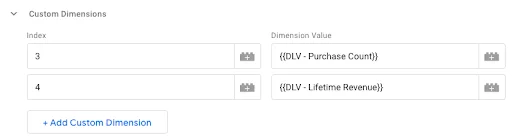
Use Google Tag Manager to send your retention metrics to Google Analytics, using the custom dimension or metric locations/indices depending on how you configured them in step 1.
Now that this data is available in Google Analytics, you can do whatever you want with it! Here are a few examples. Using LTV in a custom Google Analytics report
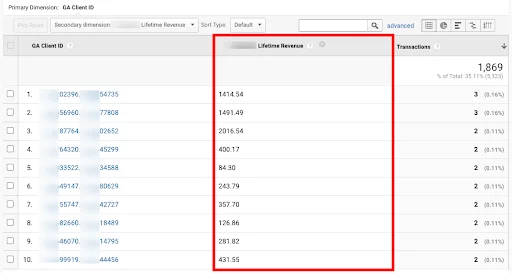
LTV in the Google Analytics User Explorer report
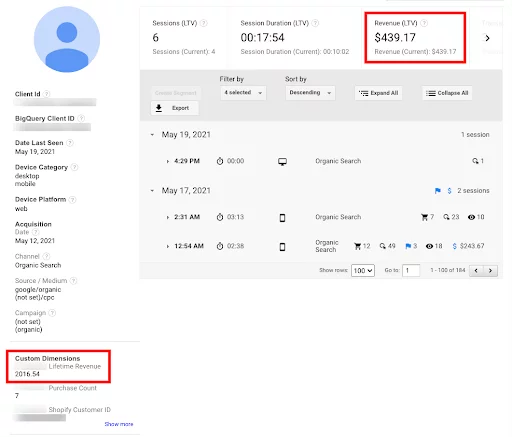
Note the difference between LTV that Google Analytics shows by default ($439) and the value we see in the custom dimension ($2,016). This is because Google Analytics can’t track the user as accurately as your backend system or the e-commerce platform you use. The same is true for other retention metrics, obtaining accurate metrics requires custom work.
Custom segments in Google Analytics
The list of possible use cases for this type of data is endless. We therefore recommend that you create custom segments in Google Analytics for customers in the top 10% in terms of LTV to see what differentiates them from the rest of the visitors. Apart from the fact that a percentage of these customers make more/larger purchases, of course. Things like their traffic source, the pages they landed on, the A/B test variants they saw, etc. can be very informative.
Data storage and analysis on a larger scale
But if you want to take it to the next level, to analyze in depth and optimize customer loyalty and lifecycle, you need a dedicated data management system. Here’s a quick, step-by-step guide:
- Send all Google Analytics data to a specific data management system (e.g. BigQuery). Tools using the Reporting API (most of them) can get you started, but to get real, unsampled data at the results level, you need a tool like Parallel Tracking.
- Transfer, sort and feed data from other relevant sources into your data management system. This could be your database, CRM, marketing tools, advertising platforms, customer support, live chat or any other tool that contains data about your customers and their interactions with your brand. Self-service tools like Stitch can help you get started, but we recommend more flexible solutions.
- Finally, to access the data stored in your data system: you need a tool (they may be separate tools) capable of handling ad hoc queries, dashboards, automated reports and the creation of data models. Solutions like Google Data Studio will get you started. But Looker or Tableau are more powerful. In any case, the best solution will be made up of a set of tools that are optimal for you, and tailored to your specific needs.
If Google Analytics has enabled you to produce all sorts of useful reports and analyses, with the configuration above, you’ll see just how rich, not to say unlimited, the options become!
An appropriate data management and analysis system is a real competitive advantage
Not only does it give you a very good overview of the current state of your business and your customers, it also enables you to truly optimize the user experience and journey. This leads to improved retention metrics, lower acquisition costs and higher sales. Remember, acquiring a new customer costs five to 25 times more than retaining an existing one! To convince you of the benefits of an efficient data management system, here are a few examples of questions that would otherwise be very difficult to answer:
- Purchases from which traffic channels are most likely to be redeemed at some point in the future? This could lead you to review your marketing budget.
- Which traffic sources have the highest retention/LTV?
- What is the correlation between subscription value ($) and churn?
- What is the long-term impact of your campaigns or A/B experiments?
- Do quick wins lead to higher churn or lower LTV?
Do data from different sources add up? Perhaps Google Analytics is missing some transactions that are in your backoffice, or perhaps some of them are duplicates? For example:
As you can see, Google Analytics is missing a good deal of transaction data, which requires further analysis. This is certainly something you should include in your Google Analytics database. And this is just a short list of ideas to get you thinking about what’s possible with the right data analysis system!
Working with automatic recurring events
- Recurring orders/payments
- Subscription expiry
- Expiry of payment method
- Modified/cancelled orders (e.g. due to a missing item).
If your data management system has been set up correctly, you should already have this information. Just make sure you include it in your analyses and reports. If you don’t have a data management system and are trying to solve this problem with Google Analytics alone, you’ll need to use a measurement protocol. Some of the most common subscription platforms, such as ReCharge for Shopify, integrate this functionality or can be solved by third-party solutions, but custom development is often required.
In short …
If in your line of business customers are expected to generate value more than once (repeat purchase, subscription, etc.), you need to start focusing on your retention metrics. Google Analytics can help you get started with basic metrics and limited precision. A better setup would be to combine Google Analytics with Parallel Tracking, but if you really want to optimize these metrics, you need a customized data management system where all your marketing data is collected. Do you have any questions about this? Contact us, we’ll be happy to discuss these topics with you and help you solve your data analysis problems!